
S&P 500 put up only very limited resistance at 4,136, and it became clear early in the regular session that bears would be absent. Initially, HYG and XLI sputtered, and XLF was lagging behind KRE, but this and other fleeting signs of intraday weakness, I duly immediately called as flipping the daily outlook decisively bullish, calling for a break above 4,177 already yesterday. Volume overall picked up sufficiently to repeat the daily bullish call for today in the European morning as well.
The housing data weren‘t poised to sink the markets, and copper with oil were highly indicative of that resolution early yesterday already. Rising volume in XLK, VTV, and good enough SMH transparently prepared the ground for improving market breadth – but the one factor that made me reconsider the requisites of the medium-term (bearish) outlook, was this.
Financials.
Back when I took the medium-term bearish view (mid Mar), it was well justified as two significant banks had fallen, CS was getting back on the radar screen, deposits outflows continued, and demand for the Fed emergency programs was rising. It was questionable whether KRE and XLF would stabilize.
The incentives for deposit outflows were still present (Fed hadn‘t yielded to market pressures to ease, and still doesn‘t, short-term yields kept solidly above 5%, Fed balance sheet kept declining, M2 and margin debt shrinking while consumer inflation expectations went on surging).
It took too long for FRC to fail – the odds of a sharp downside move were high in the prior two months, yet almost every market reaction to banking or disappointing data (on the correct recessionary call front), had been quite readily bought – and not even my correct call for hawkish May FOMC forced a lasting break of 4,078.
That explain why I had been issuing so many daily bullish calls with upside targets met in all these weeks and days.
Big picture, S&P 500 remains confined to a prolonged and tight trading range that took shape in the final days of Mar, and is still persisting after one failed breakout attempt – and my other risk-on metrics don‘t indicate a break higher out of their ranges either.
Crucially, this is all happening while the real economy prospects keep darkening, from JOLTS to unemployment claims (again pinned as Mar/Apr uptrend start) to consumer confidence, to manufacturing, to bank lending standards, you name it.
This means to me that the worst isn‘t over – not in terms of real economy deterioration, banking and the stock market. It merely indicates the upcoming stagflationary reality (subpar growth outdone by persistent, sticky inflation affecting markets there where it matters, in necessities of life, well beyond the owners‘ equivalent rent optics).
Yet, several developments yesterday made me urgently reevaluate the medium-term bearish outlook – crucially the parameters of it being, remaining justified (beyond the fact of positive stock market returns not exactly correlating with plunging LEIs).
First, KRE might not be in the mood of sliding too much more while XLF is reluctant to move even below May lows only – all on solid daily volume yesterday.
Second, Russell 2000 is showing signs of life, and the IWM mid Mar lows are at risk of becoming distant – again on solid daily volume.
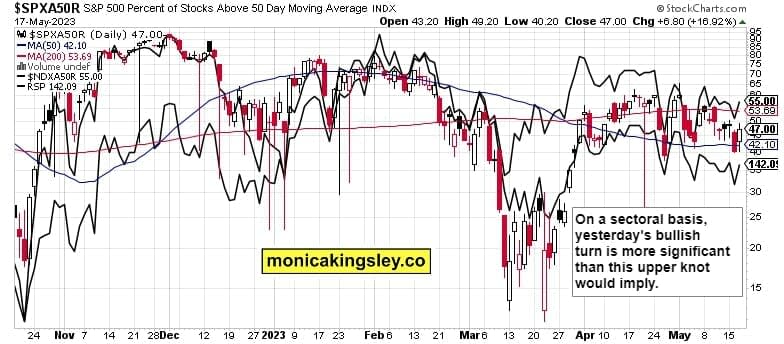
Third, market breadth as measured by percentage of stocks trading above their 50-day moving averages, improved a lot yesterday both in NDX and ES. Should we see more of that, rotations getting stronger, and leaving the 500-strong index less dependent on the Top 10 chiefly tech stocks, the buyers would rejoice.
Fourth, this weaknening tech (and communications) leadership is underlined by defensives (utilities, staples) turning considerably more constructive, which is what financials seek to follow. Add in XLI refusing more weakness while XRT goes up, and things could get dangerous for the bears fast.
If.
If not just 4,177 or 4,188, but 4,209 (called for you back in Apr as the real resistance) get broken to the upside (considering this scenario, ignore the waning volume at range‘s tops while the range‘s bottoms get bought convincingly), proving the above described bullish turns to be more that gyrations within their own ranges and deteriorating macroeconomic dynamics.
The “least” of which being debt ceiling (positive noises slash resolution) headline sensitivity with additional risk-on fuel as USD hiding place gets a hit, and stocks get chased anew.
The Fed though is in a different position than it was in 2011 – now it just can‘t turn around and provide a bid for Treasuries (hello TGA), which is why I‘m not looking for yields to retreat in the debt ceiling resolution aftermath the way they did 12 years ago.
Keep enjoying the lively Twitter feed via keeping my tab open at all times (notifications on aren’t enough) – combine with Telegram that always delivers my extra intraday calls (head off to Twitter to talk to me there), but getting the key daily analytics right into your mailbox is the bedrock.
So, make sure you‘re signed up for the free newsletter and make use of both Twitter and Telegram – benefit and find out why I’m the most blocked market analyst and trader on Twitter.
Let‘s move right into the charts (all courtesy of www.stockcharts.com) – today‘s full scale article contains 4 of them.
S&P 500 and Nasdaq Outlook
The biggest danger for bears comes from broadening rotation out of (Big) Tech into value and smallcaps, respectively. I‘m not discounting this scenario as improbable – the rotation dynamics speaks for the bulls now as financials keep ignoring KRE that would come back to bite the regional banks.
Credit Markets
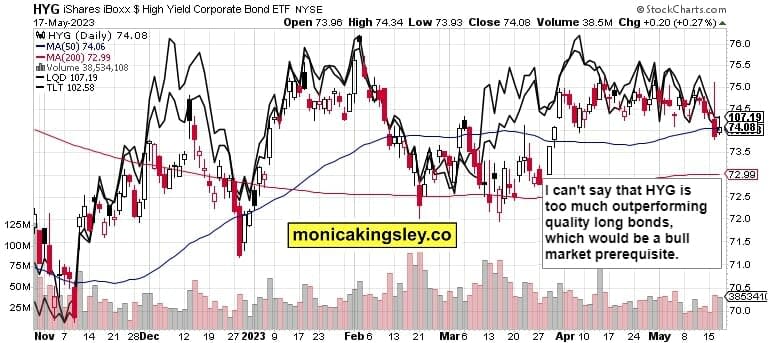
Rising yields haven‘t brought down stocks really, and corporate junk bonds aren‘t anyhow wildly outperforming. At best, they‘re peeking higher as much as inflation expectations do, merely reinforcing upcoming stagflationary reality. Sure, the word stagflation comes from stagnation, but I think there is no avoiding recession (Q3 arrival remains most likely).
Thank you for having read today‘s free analysis, which is a small part of my site‘s daily premium Monica’s Trading Signals covering all the markets you’re used to (stocks, bonds, gold, silver, miners, oil, copper, cryptos), and of the daily premium Monica’s Stock Signals presenting stocks and bonds only. Both publications feature real-time trade calls and intraday updates.
While at my site, you can subscribe to the free Monica‘s Insider Club for instant publishing notifications and other content useful for making your own trade moves.
Turn notifications on, and have my Twitter profile (tweets only) opened in a fresh tab so as not to miss a thing – such as extra intraday opportunities. Thanks for all your support that makes this great ride possible!
Thank you,
Monica Kingsley
Stock Trading Signals
Gold Trading Signals
Oil Trading Signals
Copper Trading Signals
Bitcoin Trading Signals
All essays, research and information represent analyses and opinions of Monica Kingsley that are based on available and latest data. Despite careful research and best efforts, it may prove wrong and be subject to change with or without notice.
Monica Kingsley does not guarantee the accuracy or thoroughness of the data or information reported. Her content serves educational purposes and should not be relied upon as advice or construed as providing recommendations of any kind.
Futures, stocks and options are financial instruments not suitable for every investor. Please be advised that you invest at your own risk. Monica Kingsley is not a Registered Securities Advisor. By reading her writings, you agree that she will not be held responsible or liable for any decisions you make.
Investing, trading and speculating in financial markets may involve high risk of loss. Monica Kingsley may have a short or long position in any securities, including those mentioned in her writings, and may make additional purchases and/or sales of those securities without notice.