In the fast-paced and highly competitive business world of today, conducting thorough company analysis is essential for investors and industry observers. In this article, we will conduct an extensive industry comparison, evaluating Visa (NYSE:V) in relation to its major competitors in the Financial Services industry. Through a detailed examination of key financial metrics, market standing, and growth prospects, our objective is to provide valuable insights and illuminate company's performance in the industry.
Visa Background
Visa is the largest payment processor in the world. In fiscal 2022, it processed over $14 trillion in total volume. Visa operates in over 200 countries and processes transactions in over 160 currencies. Its systems are capable of processing over 65,000 transactions per second.
When closely examining Visa, the following trends emerge:
Debt To Equity Ratio
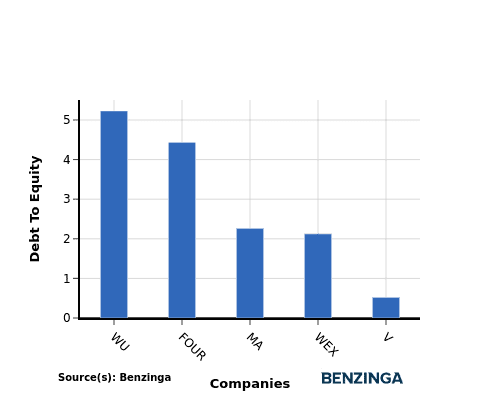
The debt-to-equity (D/E) ratio gauges the extent to which a company has financed its operations through debt relative to equity.
Considering the debt-to-equity ratio in industry comparisons allows for a concise evaluation of a company's financial health and risk profile, aiding in informed decision-making.
In terms of the Debt-to-Equity ratio, Visa stands in comparison with its top 4 peers, leading to the following comparisons:
Key Takeaways
For Visa, the PE ratio is low compared to peers, indicating potential undervaluation. The high PB and PS ratios suggest strong market sentiment and revenue multiples. In terms of ROE, EBITDA, and gross profit, Visa demonstrates high profitability and operational efficiency. However, the low revenue growth may indicate a slower expansion rate compared to industry peers in the Financial Services sector.
This article was generated by Benzinga's automated content engine and reviewed by an editor.
© 2024 Benzinga.com. Benzinga does not provide investment advice. All rights reserved.