By Nidhi Jacob
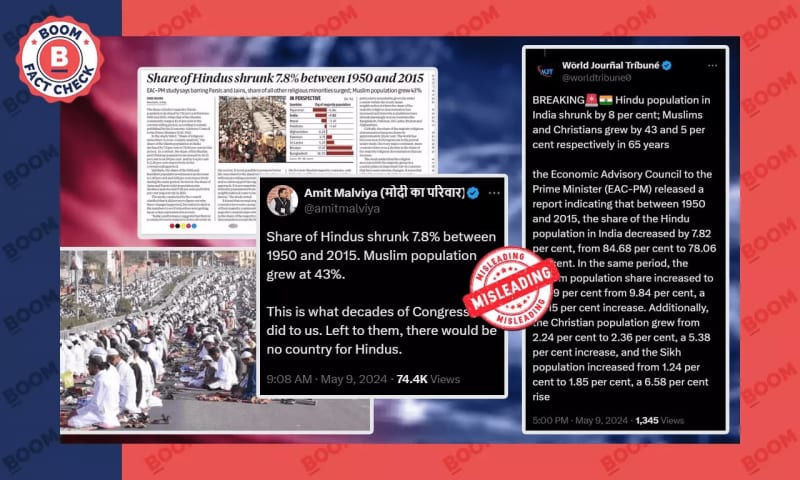
Social media platforms are rife with misleading claims suggesting that the Prime Minister's Economic Advisory Committee's working paper states a 7.8% decline in the Hindu population and a 43% rise in the Muslim population between 1950 and 2015. Additionally, multiple posts on X have amplified this claim with communal undertones.
BOOM found that the figures in the claims have been cherry-picked to exaggerate the growth of the Muslim population while overlooking the declining trend in growth and fertility rates among all religious groups in recent decades.
(Archive link)
(Archive link)What does the paper say?
The Prime Minister’s Economic Advisory Council (PM-EAC) released a working paper on its website this month titled "Share of Religious Minorities: a Cross-Country Analysis (1950-2015).”
The paper examines changes in the share of population of religious minorities across 167 countries, including India, between 1950 and 2015. At the outset, the paper shows that the share of India’s religious majority, Hindus, decreased by 7.81%, during the specified time period, a figure much lower than the global average. Globally, the share of the majority religious denomination had dropped by 22%.
Under the subsection for India, the paper reports that the share of the majority Hindu population decreased by 7.82% between 1950 and 2015, declining from 84.68% of the total population to 78.06%. Meanwhile, the share of the Muslim population increased from 9.84% in 1950 to 14.09% in 2015, marking a 43.15% increase in their share.
This particular section of the paper was culled out by various news publications, right-wing websites like OpIndia and social media users who presented it misleadingly that the Hindu population shrunk by 7.8% while the Muslim population grew by 43%, without providing sufficient context.
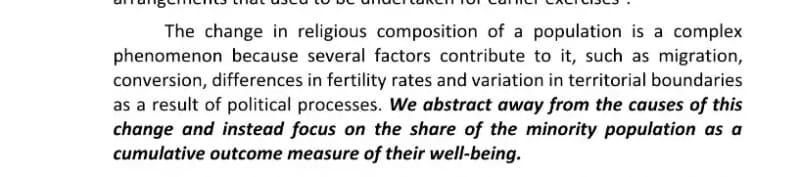
The paper highlights that the change in religious makeup of a population is a “complex phenomenon” and includes various factors such as migration, conversion, differences in fertility rates and changes in territorial boundaries as a result of political processes. It adds, “We abstract away from the causes of this change and instead focus on the share of the minority population as a cumulative outcome measure of their well-being.”
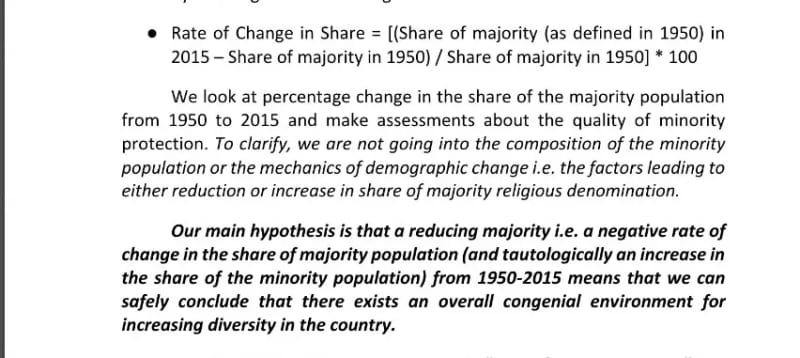
The paper also emphasises that a “reducing majority, i.e. a negative rate of change in the share of majority population (and tautologically an increase in the share of the minority population) from 1950-2015 means that we can safely conclude that there exists an overall congenial environment for increasing diversity in the country.”
At the same time, political leaders from the ruling party, including Prime Minister Narendra Modi, in his recent election rallies. delivered speeches with communal undertones, referring to Muslims as "infiltrators" and “those who have a large number of children”. Modi also claimed that the Congress manifesto proposed a comprehensive survey of all assets in the country, including gold owned by women, with the intention of redistributing assets to Muslims. But BOOM fact-checked this claim and found it to be misleading, as the Congress manifesto made no mention of redistributing wealth to Muslims.
Additionally, the paper includes the mathematical formula it used to calculate the "rate of change in share" of the population between 1950 and 2015.
Old Census data, cherry-picked and misinterpreted
The paper cites data from a 2017 research study on religious demographics of different countries which in turn sources its data from the Association of Religion Data Archives (ARDA).
While these sources have taken data from India’s Census up to 2011, the data for 2015 is derived from population projections based on previous Census figures. The last decadal Census took place in 2011, and the next, scheduled for 2021, has not yet been conducted.
First, the paper uses the “rate of change in share" for calculating the change in the share of a population. The share of the Hindu population decreased by 7.82% between 1950 and 2015 in India, and that of Muslims increased by 43.15%, it states. While this calculation is not wrong, it fails to present a more statistically accurate way of looking at the change in share of the population of Muslims, Hindus and other religions.
A statistically coherent approach to presenting data would involve analysing the change in percentage points. In this case, the share of Hindu population decreased by 6.62 percentage points (from 84.68% of the total population to 78.06% between 1950 and 2015) , while that of the Muslim population increased by 4.25 percentage points (9.84% to 14.09%).
This method avoids exaggerating the figures of the Muslim population share, which is already significantly lower than that of Hindus.
Secondly, what the EAC paper and the social media posts have not emphasised is that all religious groups in India have grown between 1950 and 2011.
In absolute numbers, the Hindu population remains the largest religious group in the country. In 1951, India had a population of around 36 crore people. Out of this, over 84% of the total population or more than 30 crore people belonged to the Hindu community whereas only 3.5 crore or 9.8% of the total population were from the Muslim community.
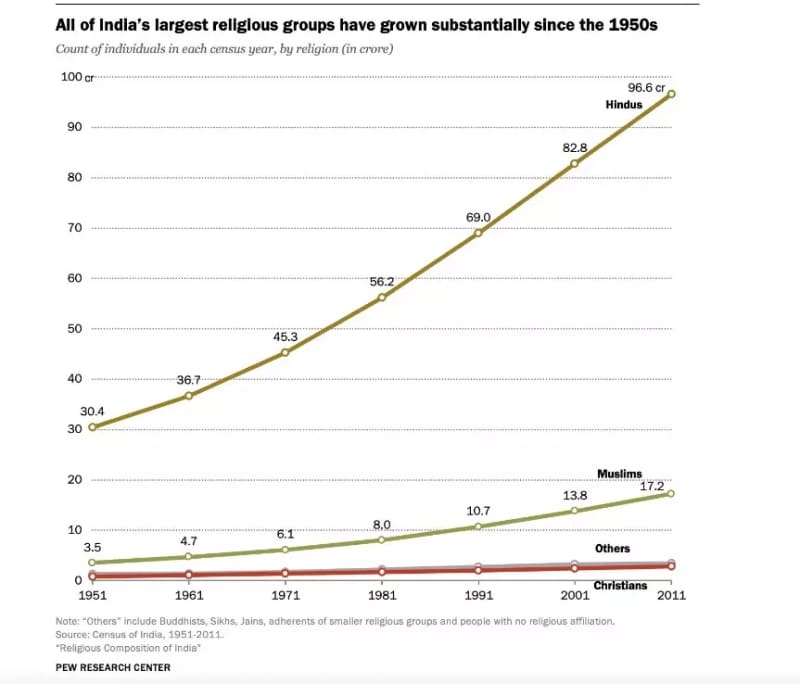
Source: Pew Research Center
In 2011, the Hindu population increased to 96.6 crore people and Muslims increased to more than 17.2 crore people. While the share of Hindus in India's overall population decreased from 84% in 1951 to approximately 78% in 2011, they continue to form the majority of the population in the country.
Decline in growth rate and total fertility rate in Muslims
The growth rate declined more substantially for Muslims compared to Hindus over the past three decades, from 32.9% in 1981-1991 to 24.6% in 2001-2011. For Hindus, the growth rate fell from 22.7% to 16.8% over the same period.
Similarly, total fertility rates (TFR) among all religious groups are reducing. But the most significant decline has been among Indian Muslim women, from 4.4 children per woman in 1992 to 2.36 in 2019-21, the latest year for which religion-wise data is available from India’s National Family Health Survey. Among Hindus it dropped from 3.3 children per woman to 1.94 during the same period.
While calling out misreporting by media outlets regarding the EAC’s paper, the Population Foundation of India (PFI), a non-profit that addresses population issues and works towards development policies, said that the narrowing gap in childbearing between religious groups means that the fertility rates are “converging” or becoming more similar across different religious communities.
Besides, PFI also said that growth and fertility rates are not linked to religion but education and income levels. States with higher levels of education, healthcare, and overall socioeconomic development tend to have lower TFRs across all religious communities. For example, they said that the TFR among Muslim women in Kerala (2.25) is lower than the TFR among Hindu women in Bihar (2.88).
PHI also stated that EAC's study focussed on changes in the share of majority and minority religious groups globally over a 65-year period and it "should not be used to incite fear or discrimination against any community."