
In the preceding three months, 4 analysts have released ratings for Realty Income (NYSE:O), presenting a wide array of perspectives from bullish to bearish.
Summarizing their recent assessments, the table below illustrates the evolving sentiments in the past 30 days and compares them to the preceding months.
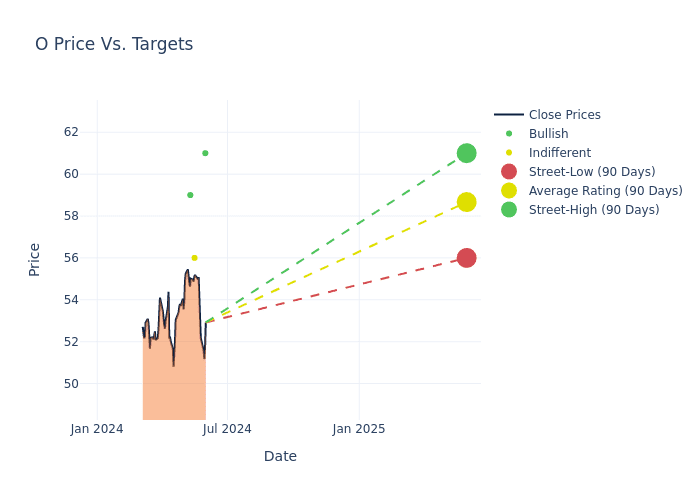
In the assessment of 12-month price targets, analysts unveil insights for Realty Income, presenting an average target of $58.0, a high estimate of $61.00, and a low estimate of $56.00. Observing a downward trend, the current average is 2.11% lower than the prior average price target of $59.25.
Interpreting Analyst Ratings: A Closer Look
The standing of Realty Income among financial experts becomes clear with a thorough analysis of recent analyst actions. The summary below outlines key analysts, their recent evaluations, and adjustments to ratings and price targets.
Key Insights:
- Action Taken: Responding to changing market dynamics and company performance, analysts update their recommendations. Whether they 'Maintain', 'Raise', or 'Lower' their stance, it signifies their response to recent developments related to Realty Income. This offers insight into analysts' perspectives on the current state of the company.
- Rating: Providing a comprehensive analysis, analysts offer qualitative assessments, ranging from 'Outperform' to 'Underperform'. These ratings reflect expectations for the relative performance of Realty Income compared to the broader market.
- Price Targets: Analysts navigate through adjustments in price targets, providing estimates for Realty Income's future value. Comparing current and prior targets offers insights into analysts' evolving expectations.
Analyzing these analyst evaluations alongside relevant financial metrics can provide a comprehensive view of Realty Income's market position. Stay informed and make data-driven decisions with the assistance of our Ratings Table.
Stay up to date on Realty Income analyst ratings.
About Realty Income
Realty Income owns roughly 13,400 properties, most of which are freestanding, single-tenant, triple-net-leased retail properties. Its properties are located in 49 states and Puerto Rico and are leased to 250 tenants from 47 industries. Recent acquisitions have added industrial, gaming, office, manufacturing, and distribution properties, which make up roughly 17% of revenue.
Realty Income's Financial Performance
Market Capitalization Analysis: Above industry benchmarks, the company's market capitalization emphasizes a noteworthy size, indicative of a strong market presence.
Revenue Growth: Over the 3 months period, Realty Income showcased positive performance, achieving a revenue growth rate of 33.47% as of 31 March, 2024. This reflects a substantial increase in the company's top-line earnings. In comparison to its industry peers, the company stands out with a growth rate higher than the average among peers in the Real Estate sector.
Net Margin: Realty Income's net margin lags behind industry averages, suggesting challenges in maintaining strong profitability. With a net margin of 10.29%, the company may face hurdles in effective cost management.
Return on Equity (ROE): The company's ROE is below industry benchmarks, signaling potential difficulties in efficiently using equity capital. With an ROE of 0.36%, the company may need to address challenges in generating satisfactory returns for shareholders.
Return on Assets (ROA): Realty Income's ROA falls below industry averages, indicating challenges in efficiently utilizing assets. With an ROA of 0.21%, the company may face hurdles in generating optimal returns from its assets.
Debt Management: The company maintains a balanced debt approach with a debt-to-equity ratio below industry norms, standing at 0.66.
Analyst Ratings: What Are They?
Analysts work in banking and financial systems and typically specialize in reporting for stocks or defined sectors. Analysts may attend company conference calls and meetings, research company financial statements, and communicate with insiders to publish "analyst ratings" for stocks. Analysts typically rate each stock once per quarter.
In addition to their assessments, some analysts extend their insights by offering predictions for key metrics such as earnings, revenue, and growth estimates. This supplementary information provides further guidance for traders. It is crucial to recognize that, despite their specialization, analysts are human and can only provide forecasts based on their beliefs.
This article was generated by Benzinga's automated content engine and reviewed by an editor.
Latest Ratings for O
View More Analyst Ratings for O
View the Latest Analyst Ratings
© 2024 Benzinga.com. Benzinga does not provide investment advice. All rights reserved.