Based on the continuous futures contract, corn prices peaked at nearly $8.25 in May 2022. The rally was in response to the Russian attack on Ukraine, forcing international grain prices to rally. Since that time, the price has declined to $4.50. Corn has a bullish seasonal pattern after the planting season, pushing prices to a high in mid-June, resulting in some analysts looking for corn to peak near $6.00. This may seem optimistic with the burdensome carry-over from the last harvest hanging over the market.
This leads one to wonder, what comes first, $3.25 or $6.00 per bushel for new crop corn?
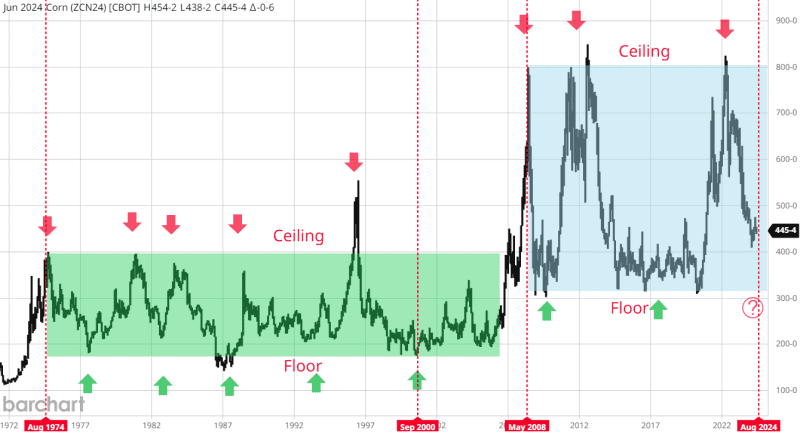
Source: Barchart.com
The corn market has had an interesting trading pattern since 1974. Reviewing the continuous monthly futures chart, we can see the floor and ceiling prices from 1974 to 2000 (green box.) This is significant because of the pattern of each time prices rallied to the ceiling prices near, at, or beyond all-time highs (red arrows), and the subsequent price direction was down to the floor prices (green arrows). As prices increase, corn producers are incentivized to plant more corn to exploit the high prices, thereby oversupplying the market. The price has to drop to levels (floor prices) to entice buyers to bid for corn aggressively.
The above-mentioned ceiling and floor prices remained at that level until 2007, when prices traded outside the range. In May 2008, prices topped off, and a new ceiling area was created (blue box). Multiple times, the corn market approached this new ceiling (red arrows), and each time, the price was rejected and returned to the floor area (green arrows). From 2008 to 2024, this pattern has held.
Recent article
In a recent article for Barchart, "Is Corn Ready for a Seasonal Pre-Summer Rally?" I mentioned the corn market's headwinds: "The carry-over from the previous crop year was excessive and may result in a smaller pre-summer price rally than usual. As producers see prices rallying to levels where they can hedge their new crop and retain a profit, we could see more aggressive commercial selling into rallies. Keep an eye on the COT report that is released each Friday."
Commitment of Traders (COT) Report
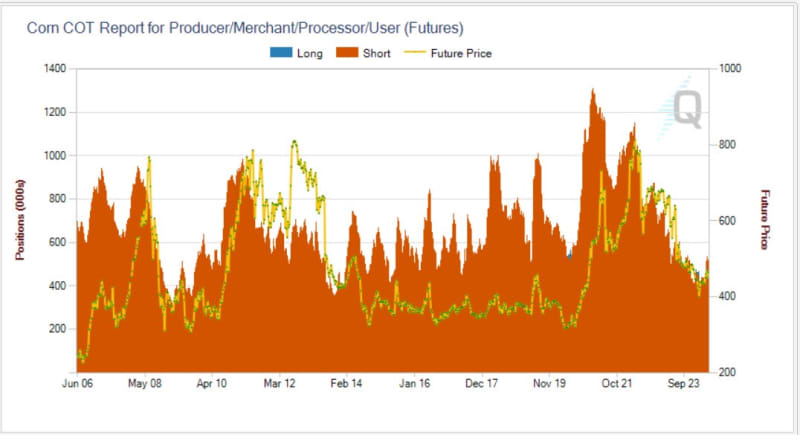
Source: CMEGroup Exchange
The COT report for corn back to 2006 shows how aggressively the commercial traders (producers and elevators) were selling (orange vertical lines) when prices approached these ceilings to hedge their crops. The price of the corn market is shown in yellow.
Seasonal Pattern
Moore Research Center Inc. (MRCI) reports that in their research, they found a reliable selling pattern coming soon in the corn market. Their research includes multiple timeframes, 5, 15, and 30-year seasonal patterns. Seasonal patterns change over time in differing markets as supply and demand fundamentals oscillate, resulting in the 5-year seasonal pattern changing first with the most recent data. This early change in a seasonal pattern can sometimes impact the longer-term 15- and 30-year pattern.
Currently, corn is experiencing that shift. The 5-year (red) and 15-year (black) patterns are topped out in mid-June. The lows of the season are coming earlier, and the 5-year pattern shows an upturn in late August to early September, while the 15-year is showing an upturn in prices in early October. Will the 5-year seasonal eventually impact the 15-year?

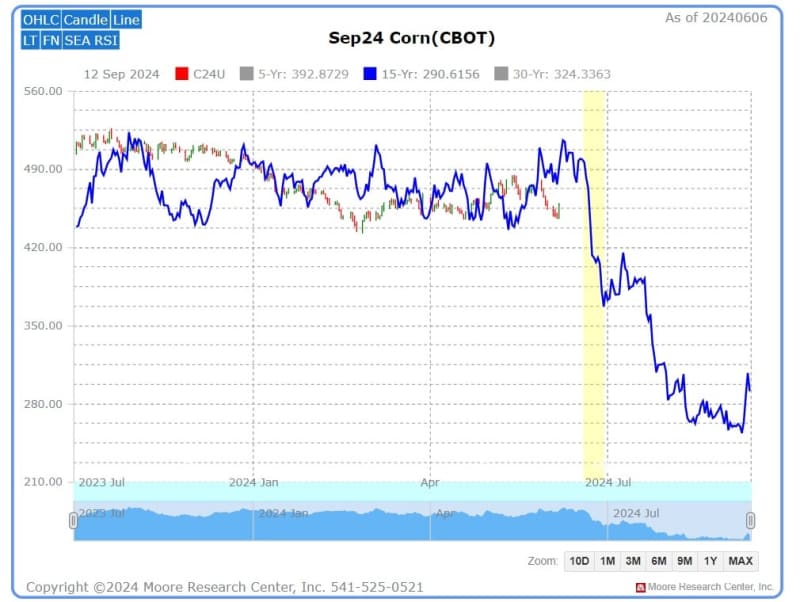
Source: MRCI
Source: MRCI
The September corn contract illustrates the seasonal sell. However, the September corn contract is often called new crop corn, and it is typically used by corn producers in the Southeastern region due to warmer weather and an earlier planting season. Most corn producers across the corn belt use the December contract, which is more liquid and better represents the new crop.
The mentioned seasonal window to sell corn is relatively short. However, the corn market should continue with bearish price action after the seasonal pattern expires. The downtrend must stay intact.
MRCI has found that corn prices close lower on approximately June 29 than on June 19. Their research reveals that 13 of the past 15 years were profitable. The most significant part of this sell pattern is that during these 15 years, 8 never had a daily closing drawdown. That's better than 50% of the time not losing sleep over a trade.
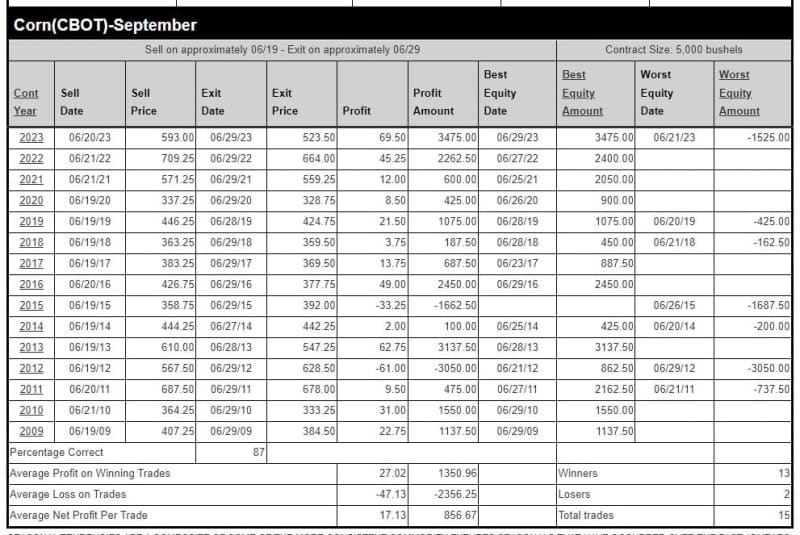
Source: MRCI
It's important to note that while seasonal patterns can provide valuable insights, they should not be the sole basis for trading decisions. Traders must consider other technical and fundamental indicators, risk management strategies, and market conditions to make well-informed and balanced trading choices.
In closing….
Historical patterns, seasonal trends, and fundamental supply and demand factors shape the corn market's price dynamics. While seasonal patterns, such as those identified by the Moore Research Center Inc., offer valuable insights, they should be integrated with broader market analyses and risk management strategies for effective decision-making. The current market environment, characterized by a significant carry-over from previous harvests, poses challenges that may temper price rallies. As traders and producers navigate these conditions, all should remain vigilant and adaptable, considering relevant data and market signals. The future direction of corn prices, whether towards $3.25 or $6.00 per bushel, will depend on the interplay of these factors and the market's response to ongoing supply and demand shifts.
Traders may use the corn futures symbol ZC or the exchange-traded fund CORN to participate in this market.
More Stock Market News from Barchart
On the date of publication, Don Dawson did not have (either directly or indirectly) positions in any of the securities mentioned in this article. All information and data in this article is solely for informational purposes. For more information please view the Barchart Disclosure Policy here.