
Invesco QQQ ETF (QQQ) has become the biggest technology ETFs with over $286 billion in assets. It has done this well by tracking Nasdaq 100, the most popular tech-focused Nasdaq 100 index in the world.
While QQQ is the most popular tech ETF, other alternatives from State Street and Blackrock have a better track record in terms of performance.
The SPDR Technology Select Sector (XLK) and the iShares US Technology ETF (IYW), which have $71 billion and $18.8 billion in assets, are beating QQQ this year.
Data shows that the QQQ ETF’s total return this year stood at 18.60% while the XLK and the IYW have jumped by 20.2% and 24%, respectively.
This trend goes for a long time. In the past five years, QQQ has returned 173% while the other two have had 220% and 225%. The chart below shows their performance in the past three years.
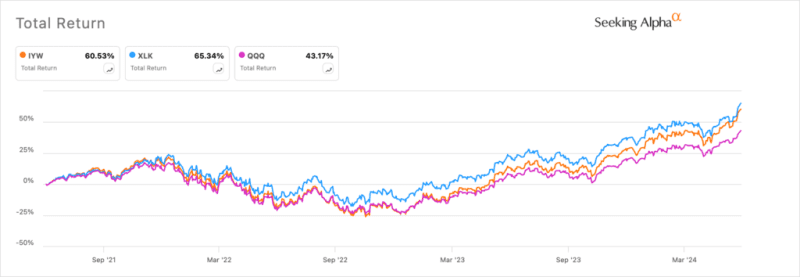
IYW vs QQQ vs XLK
The three ETFs achieve their returns using different approaches. QQQ simply tracks companies in the Nasdaq 100 index while the XLK tracks the Technology Select Sector Index. This index tracks 68 of the biggest technology companies in the S&P 500 index. It is also one of the cheapest funds with an expense ratio of 0.04%.
The iShares US Technology ETF, on the other hand, tracks tech companies in the Russell 1000 Technology Capped Index. It has 136 companies and has an expense ratio of 0.40%, double that charged by QQQ.
These ETFs will likely continue to do well this year for three main reasons. First, there are signs that most tech companies are seeing robust earnings. A report by FactSet showed that the S&P 500 index had earnings growth of about 5.4%, the highest level since 2020.
Second, the Fed has committed to start cutting interest rates later this year or early 2025. Rate cuts will benefit technology companies by triggering a risk-on sentiment. They will also help to draw investors from the bond market since money market funds have accumulated over $6.1 trillion in assets, which will rotate back to stocks.
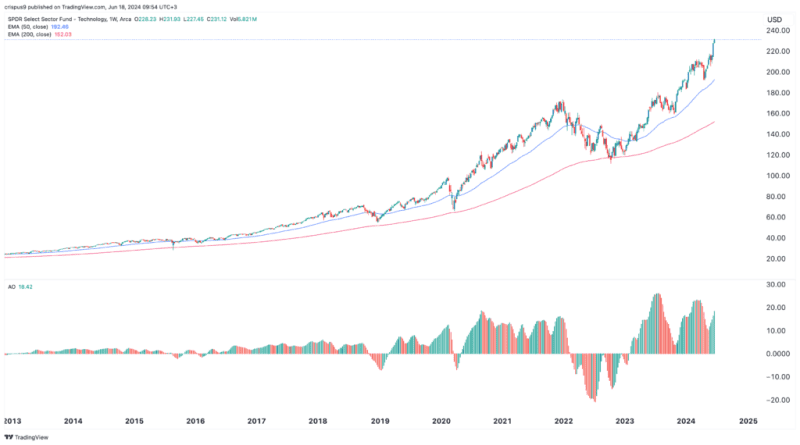
XLK ETF chart
Third, these ETFs will likely continue doing well because of the ongoing momentum. As shown above, the XLK ETF has constantly remained above the 50-week and 200-week Exponential Moving Averages (EMA) while the Awesome Oscillator has remained above the neutral point.
Therefore, the path of the least resistance for the index is upward, with the next point to watch being at $250. If this happens, the QQQ and IYW ETFs will also continue rising. The biggest risk for IYW, QQQ, and XLK is that they have become highly overvalued. The XLK ETF has a forward price to earnings ratio of 31.50 and a price-to cash flow multiple of 27.60. On the other hand, the IYM ETF has a price-to-earnings multiple of 43.90 while QQQ has a P/E multiple of 33.3.
The post Move on QQQ ETF: XLT and IYM are firing on all cylinders appeared first on Invezz