Saga Partners commentary for the first half ended June 2021, discussing their investment in Goodrx Holdings Inc (NASDAQ:GDRX) and their new position in Redfin Corp (NASDAQ:RDFN).
Q2 2021 hedge fund letters, conferences and more
H1 2021 Results
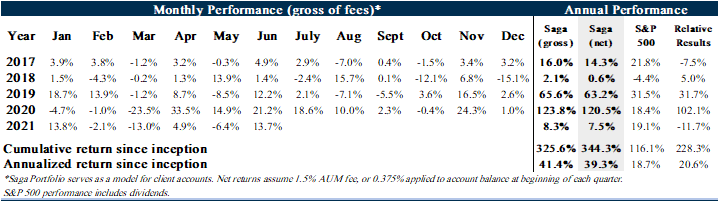
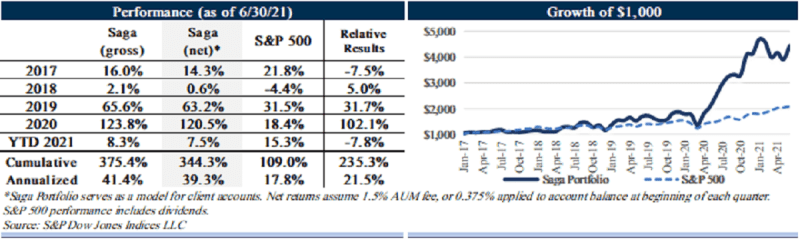
During the first half of 2021, the Saga Portfolio (“the Portfolio”) increased 7.5% net of fees. This compares to the overall increase for the S&P 500 Index, including dividends, of 15.3%.
The cumulative return since inception on January 1, 2017 for the Saga Portfolio is 344.3% net of fees compared to the S&P 500 Index of 109.0%. The annualized return since inception for the Saga Portfolio is 39.3% net of fees compared to the S&P 500’s 17.8%. Please check your individual statement as specific account returns may vary depending on timing of any contributions throughout the quarter.

Investing In The Public Market
The stock market has proven to be one of the greatest wealth generation vehicles ever. The majority of the greatest companies in the world are publicly traded and anyone has the ability to invest in them. Only in relatively recent history have people been able to participate in the economy’s value creation by owning a small piece of the overall market, benefitting from the modern corporate structure.
Throughout most of human history, individual people (think hunter-gatherers) put time and energy into resources to make different products/services that they demanded. Over time, people increasingly focused on core competencies and traded with others who had a relative advantage in producing other products/services. By specializing, the same energy input could provide a greater output which increased productivity and standards of living, making it possible for 1 + 1 = 3. Adam Smith described this phenomenon as the division of labor in The Wealth of Nations.
As “jobs to be done” became increasingly complex and capital intensive, individuals did not have the required capital, time, and expertise. A need for greater resources and some bureaucracy to help guide the different efforts grew. Governments were formed and have historically been the primary driver of complex efforts that involved a large number of people and resources, largely surrounding infrastructure and defense.
In the early 1800s economic growth accelerated with the onset of the Industrial Revolution. The ability to utilize coal/steam power led to growth in manufacturing, shipping, and railroads, which required the aggregation of even greater capital/resources that were far too large for any one person or even one government to back. Corporations shifted away from government-approved charters more common with joint stock companies in the 1600s, and towards privately funded companies independent of the government.
During the 1800s, the majority of publicly traded companies available to outside shareholders were railroads and small banks, with transportation companies representing over 80% of the stock market at its peak. The first price weighted stock index was composed by Charles Dow in 1884 and contained nine railroads and two industrial companies. In the early 1900s, more diverse corporations with various internal departments and organizational structures started to resemble what we see today, with companies such as General Electric, Dupont, AT&T, and General Motors. While it was common for a controlling family to own most of a company, shares were increasingly owned by passive, non-controlling shareholders. The first market weighted index was formed in 1928 with the Standard & Poor’s Index of 90 that included the largest industrial companies in the United States.
An interesting reality is that over the very long-term, the market as a whole outperforms nearly every individual publicly traded company. Over the last 10 years only 17% of companies beat the S&P 500’s 14.8% IRR, and over the last 50 years, only 2% of companies beat the index. Fewer than 20 companies beat the S&P 500 by over 5% annually over the last 50 years.
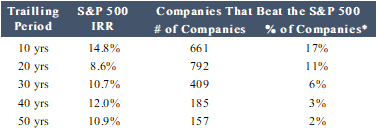
Source: Factset, Saga Partners
Note: Return data as of 6/30/21
Based on estimated publicly traded companies at the start of time period. Only includes companies traded on U.S. stock exchanges.*
There are two primary reasons why individual publicly traded companies have such a difficult time matching the performance of the general market over the long-term:
1. High-Quality: In order for a company to provide strong returns over the very long-term it has to earn high returns on invested capital. High-quality companies are rare and over long enough time periods will inevitably be disrupted.
2. Market Expectations/Efficiency: The market is generally pretty good at valuing companies, and in order for a stock to outperform the market, it has to exceed the market’s expectations of its future performance.
It’s a double whammy. Not only does a company have to provide stellar long-term fundamental results (very difficult to do in a competitive economy), but those results also have to exceed the market’s initial expectations. Let’s dig into these two factors.
Using the most generic definition, a high-quality company is one that can generate a lot of cash relative to its required operating capital for a very long-time. By cash I mean earnings power or what Warren Buffett has referred to as owner earnings. It’s the cash left over after all the expenses required to fully maintain the business’ long-term competitive position and its current unit volume.
While not impossible, it is very difficult to earn attractive investment returns from a company that has low earning power relative to invested capital. A bad business is one that grows a lot, requires a lot of capital to grow, and then earns little to no cash. A low-quality company, i.e. an undifferentiated commoditized product/service has no pricing power. Customers will pay the lowest price and suppliers will only earn their cost of capital at best. A price exists that makes a low-quality company an attractive investment. However, that price is often much lower than investors typically believe because any additional required capital to maintain the business (likely resulting from inflation) will consume any modest cash flow the business generates, leaving shareholders with little leftover.
As a quick aside, the definition of quality noted above is well known and the quantitative analysis can easily be calculated in Excel. However, the more important analysis is understanding the many qualitative inputs it takes to reach the desired quantitative outputs an investor seeks. In fact, a high return on capital could be a reflection of underinvestment and a less promising future while a low return on capital may reflect purposefully underearning and/or significantly reinvestment in attractive opportunities. Eventually the numbers matter but understanding a company’s differentiation, mission, culture, and value proposition is key to determining its quality. If a company adds significant value within its value chain over time, the numbers should eventually work out.
That brings me to the next topic regarding quality where there has been some confusion by those that may glance over a company’s cash flow or income statement and see cash outflows or losses and then believe the company to be low-quality. To clarify, free cash flow or GAAP earnings are not owner earnings. Owner earnings are before growth spending. After spending on maintenance expenses, management has the choice to either reinvest owner earnings for future growth or return the cash to shareholders. If there are significant opportunities to invest beyond the owner earnings or current resources of the company, then management may access outside capital by either raising additional debt or equity. Although if management continues to invest in growth opportunities leaving little cash leftover at the end of each year and earning power does not make any upwards progress over a long enough testing period, one must start to question the true attractiveness of such investments.
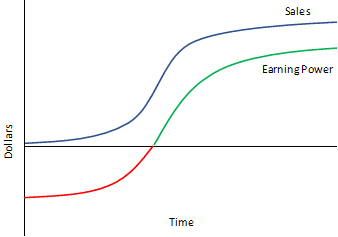
It’s important to distinguish between maintenance and growth costs to approximate a company’s earnings power. Companies, like many things in nature, follow a common life cycle pattern often referred to as an S-curve. Geoffrey West in his book Scale, discusses the S-curve pattern of growth that applies to both animals and companies. In animals, energy is devoted to growth and maintenance. At birth, nearly all the energy goes toward growth and little to maintenance. But as the body grows, the mix shifts from growth to maintenance until nearly all the energy is devoted to maintenance at maturity.
Similarly, companies grow slowly at first as they search for a viable model around which to organize. If they are fortunate enough to discover product/market fit, they will then spend most of their resources (i.e. energy) in a potentially decades-long rush to grow/scale until they have reached nearly all potential customers.
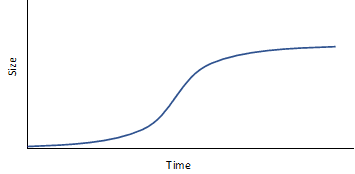
When a company has attractive investment opportunities, it makes sense for management to reinvest owner earnings back into the company for growth. It’s common earlier in a company’s life cycle for management to invest heavily, as reflected by cash outflows and net losses in anticipation of future demand. Inevitably a company’s end market(s) will become saturated and reinvestment opportunities will no longer be attractive. Once a company reaches maturity, its growth rate will hit a distinct downward inflection, marking the end of its high growth era and the beginning of a period of stability.
Near maturity, free cash flow or net income will likely be a better reflection of owner earnings as capital allocation shifts from growth to maintenance. At this point a high-quality company would earn attractive returns on its invested capital. Assuming there are no longer attractive reinvestment opportunities within its core business, management must decide what the best use of excess resources will be; either invest in other ventures outside its core operations or return capital to shareholders.
It is important to appreciate that high-quality is rare. Companies that generate a ton of owner earnings relative to invested capital for a very long time are a business owner’s dream. In a competitive market, however, capital naturally gravitates towards high returns to then compete away excess profits. Only companies that benefit from some type of durable competitive advantage relative to competitors can sustain attractive returns for owners.
However, even the best of companies will inevitably get disrupted. The question is not if but when. Companies are in a continual battle for survival. They follow a similar pattern throughout their life cycle. As a company reaches maturity and potentially establishes itself as a winner with strong competitive advantages, management’s decision-making often surrounds trying to protect its existing cash cow and less towards providing value for customers in the best way possible. Companies become more defensive.
Disruption often happens either when the external environment changes either through technological innovation, shifting customer preferences, or a company faces internal problems such as mismanagement, bureaucracy, or bloat. The fear of product cannibalization, customer conflict, or earnings dilution limits acts of creative destruction within a corporation. Clayton Christensen describes this phenomenon as the innovator’s dilemma. What has made a company successful historically is not necessarily what will make it successful in the future. The problem is likely to be even more pronounced in a company that has enjoyed a long run of success. It provides opportunity for up-and-coming companies to disrupt the status quo by utilizing a new technological innovation, discovering a lower-cost business model, or better serving changing customer needs.
Corporations typically struggle to adapt at the pace and scale of the market. In a competitive market, new companies can rise while those without strong prospects fall. Unlike a corporation, the market does not fear product cannibalization or customer channel conflict. By replacing the weaker players with more competitively advantaged newer entrants, it improves overall market returns. The market as a whole therefore outperforms nearly all businesses over the very long-term.
It’s not surprising that Berkshire Hathaway, one of the rare companies that has outperformed the S&P 500 over the last 50 years. Buffett acts as the capital allocator, taking capital from businesses it owns with poor prospects and giving it to those with more attractive opportunities. By creating a capital market dynamic, it encourages creative destruction within its corporate structure and therefore has stood the test of time.
The second reason that it is so difficult for any company’s stock to beat the market over the long-term is because the market is constantly trying to fairly value a company’s future prospects, thereby pricing out any excess returns. Most of the time, the market does a relatively good job discounting a company’s intrinsic value into its current stock price. Even if a company’s core business is high-quality and has a bright future, the only way its stock can deliver above market returns is to exceed the market’s expectations.
The one law of investing that will always be true is that an asset is worth the net cash it returns to owners over its remaining life. A stock price reflects certain expectations of the cash a company must deliver to owners in the future to justify its price. Changes in the current stock price are not driven by the direction of its fundamentals, but by how those fundamentals compare to the market’s initial expectations. A company’s results must exceed the market’s expectations just to keep its stock price from falling. It is our job as investors to assess the expectations embedded in the shares and then take advantage of gaps between expectations and fundamentals.
The difficulty in framing expectations is that the future is unknowable and that will always be the case. Everyone can only use the information available today to form a range of expectations surrounding the future. Where we believe we have discovered potential gaps between the market’s expectations and likely future fundamentals is by thinking very long-term. Most of Wall Street, at least when it comes to the public market, is focused on predicting quarterly stock price moves. Some are looking out 1-2 years and then put a price target or multiple on those expected fundamentals. A few may think out 3-5 years, but it is rare to think out 10+ years and that is exactly what you have to do if you are analyzing a company’s intrinsic value.
For most companies with a bright future (our hunting ground), intrinsic value is concentrated in the terminal value, cash flows that are expected far into the future. If you overestimate that terminal value because you don’t consider the risk of competition or disruption to the business (see section above), the investment isn’t going to work out very well over the long-term. Alternatively, there is an opportunity if Wall Street is significantly undervaluing that terminal value because it is anchoring to recent fundamentals. Gaining conviction about how a company will be positioned in 10 years is essential to public equity investing. Both opportunity and risk management reside in the long-term game and very few truly play that game.
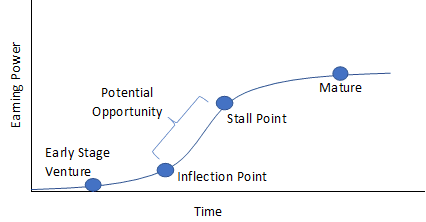
Having a good understanding of where a company sits in its life cycle or on its S-curve provides context for thinking about future value creation. Forecasts are frequently built by averaging values over recent years and then extrapolating them out into the future. This often makes sense since the recent past is one of the best predictors for the near-term future. However, this recency bias sometimes leads to forecasts early in a company’s life cycle to be too low once a company hits an inflection point. As a company scales, forecasts will likely have to be continually adjusted upward as new data is collected. Once a company’s end markets become more saturated and the growth curve begins to flatten, it reaches a stall point. Later-stage forecasts based on previous year’s growth rates may be too high and the market’s expectations exceed actual future performance. Analysts may find themselves continually adjusting their predictions lower. In this way, it gives rise to periods of a company’s stock outperforming and underperforming the market.
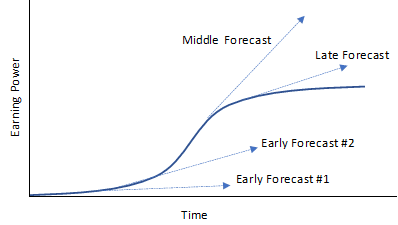
Source: Chart reproduced from the book Creative Destruction by Richard Foster and Sara Kaplan
We have had success finding undervalued companies earlier in their life cycle. Most of the best performing stocks over any 10–20-year period are ones that have established a competitive advantage, hit the inflection point on their S-curve, and then scaled its products/services further than the market initially expected. These companies are sometimes referred to as “compounders.” It is possible that the market anchors to recent fundamentals and does not fully appreciate the future opportunity for a company with a long runway to grow.
Prior to a company discovering product/market fit and hitting an inflection point, there is less proof of concept or the ability to analyze a company’s unit economics. Like most animals (with legs), companies must learn to walk before they can run. Once a flywheel starts gathering speed it typically becomes self-reinforcing. We find it difficult to differentiate between the winners and losers at the infant stage of a company’s life cycle and leave it to the venture capitalists to perform that difficult analysis.
Analysts and investors tend to be skeptical, as they should be, that companies can sustain high levels of growth for long periods of time. It is rare to find a company capable of growing sales at 20%+ annual rate for even a 10-year period, especially on a larger sales base. However, some companies can confound the market and scale much larger than initial expectations. Even some of the most followed companies in the world such as Apple, Google, Amazon or Facebook continue to exceed the market’s expectations, leading to each of their stocks outperforming the market by a wide margin.
It is among relatively newer entrants in the market where one can potentially find a wider gap between expectations and future fundamentals. Though the younger a company, the more difficult it is to predict the long-term prospects since there is less historical proof of concept or testing of its durability.
Two important factors to help analyze and value an early state company are: 1) unit economics, and 2) total addressable market (TAM). Unit economics boils down to the cost to acquire and maintain new business. If it’s economically attractive to invest in growth, a business should do so despite what that makes its current income statement look like.
Total addressable market is important because it helps quantify the size of a company’s opportunity. It also allows for an analysis of where the company currently stands on the path to its full potential. Things to consider are the adoption rate of the product/service, and more importantly, potential competition. In analyzing the TAM, one wants to be as realistic as possible. Too much conservatism will filter out some of the best investment opportunities while assumptions that are too aggressive potentially paint a rose-colored future that is sure to disappoint.
We Are Not Growth Investors; It Just Might Look That Way
While a good hunting ground for undervalued investment opportunities has been in companies earlier in their life cycle that exhibit a growing competitive advantage and a long runway to reinvest, that does not always have to be the case. That is simply where we have discovered some of the most significant dislocations between current expectations and likely long-term future fundamentals.
Below is a chart of the Saga Portfolio companies and their respective five-year sales and gross profit compounded annual growth rate (CAGR) through 2021 consensus forecast. 2020 was obviously an abnormal year given COVID’s impact, therefore 2021 expected results were used.
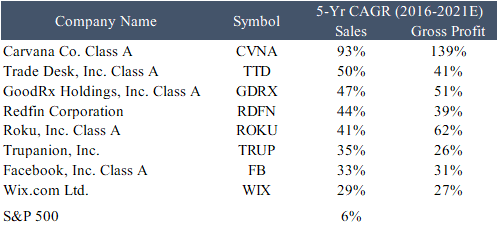
Source: Factset, Saga Partners
Contrary to what one may think when looking at the Saga Portfolio, we are not growth investors. We are simply trying to find the best opportunities available based on our future expectations relative to the current stock price.
It is important to note that investors today do not benefit from past growth. It is only future results that matter and not all growth is good. Selling dollars for fifty cents is a guaranteed path towards growth, albeit at the detriment to the seller. It is clear that the Saga Portfolio companies are far from maturity, and based on our analysis and expectations, believe the market is undervaluing each of our company’s future prospects’ otherwise we would not own them.
The Saga Portfolio’s three investment filters are:
1. Quality: Is the company building a durable competitive advantage?
2. Management: Is management high caliber and thinks/acts like owners?
3. Value: Does the current price provide an attractive return if the company is owned for 10+ years?
Meeting some arbitrary expected growth rate is not a filter for our investment selection but expected internal rate of return (IRR) is. Growth is not necessarily what is important to providing an attractive investment. What is important, as explained earlier is: 1) quality of the company, i.e. ability to earn attractive earning power on capital deployed, and 2) value, i.e. the price you pay relative to the net cash returned to shareholders over the remaining life of the company.
We would be perfectly happy to invest in a no growth or even declining company if the price today provided an attractive expected IRR. If a company is not growing, then all expenses could be considered maintenance costs to sustain the existing volume of business. Any cash that is left over at the end of the year would be considered owner’s earnings and should be returned to owners assuming there are no other attractive investment opportunities. In order for an investor to earn an attractive return on a no growth company, it would have to pay an attractive yield relative to the cash that is being returned to owners. However, when looking across the investing landscape of more mature companies, it is pretty rare that the market places a value on the expected cash returned to investors that would provide an overly attractive long-term return.
Of course, prices of even the largest, most mature companies can fluctuate significantly in any single year. We always take the view of assessing what the return to owners would be if a company were held for its remaining life, i.e. its intrinsic value. We are not trying to play a game of greater fool theory by hoping other investors will also misanalyse the value of the company and bail us out at an artificially inflated price. What is most important is having expectations that are as accurate as possible and then buying shares when the price relative to those expectations is attractive.
As I’ve attempted to explain, trying to outperform the market by picking stocks is difficult. A JP Morgan study reviewed the lifetime returns of all listed stocks from 1980-2014 and found that two-third of stocks underperformed the Russell 3000 Index and 40% of stocks provided negative absolute returns over their life. In the long run, the market as a whole will likely beat any individual company as corporations rise and fall in a continual cycle of creative destruction.
However, within the market, a select few companies provide a disproportionate amount of the total market return. Like many other things in life, the stocks that drive the market’s return follow very closely to Pareto’s 80/20 Principle. In fact, you can reapply the 80/20 rule to the 20% of companies that provide most of the returns, resulting in 4% of companies providing 64% of the market returns. This general principle turns out to be pretty close to reality where historically anywhere between 4-9% (depending on the testing period) of available stocks provide most of the market’s overall return.
The JP Morgan study found that ~7% of the stocks studied over the period generated lifetime returns more than two standard deviations over the market’s mean.
Distribution Of Excess Lifetime Returns On Individual Stocks Vs. Russell 3000, 1980-2014
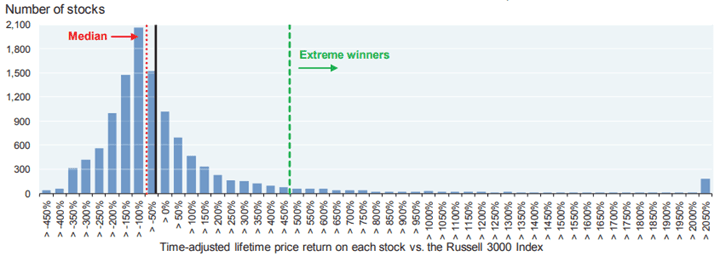
Source: Factset, J.P. Morgan Asset Management
These are the far-right tail opportunities that provide most of the index returns. The distribution of quality and returns is not based on linear models, it is driven by power laws, which is difficult for our brains to comprehend. These companies are not merely a few percent better than the median, they are an order of magnitude to the nth power better.
It reminds me of the Jeff Bezos quote:
“The difference between baseball and business is that baseball has a truncated outcome distribution. When you swing, no matter how well you connect with the ball, the most runs you can get is four. In business, every once in a while, when you step up to the plate, you can score 1,000 runs.”
It might seem like semantics to say the market is generally efficient vs. being perfectly efficient, but the actual difference between those two realities is significant. The market may appreciate the higher quality of these rare companies by giving them a higher-than-average market multiple based on its recent fundamentals. This makes them appear to be “overvalued” relative to the average company, although they are actually perpetually undervalued for much of their life.
These are the opportunities where the Saga Portfolio has found attractive investments. There is a high threshold for any investment to enter the Portfolio and we will likely misjudge the future prospects of a company from time to time. However, if we are successful in picking just a few of these far-right tail opportunities after they hit their inflection point and display a growing competitive advantage, the Saga Portfolio results as a whole should be more than satisfactory over the long-term.
Portfolio Update
Goodrx (GDRX) - Prescription Drug Value Chain
The Saga Portfolio first bought Goodrx Holdings Inc (NASDAQ:GDRX) at the end of 2020 and has added to it throughout 2021. As it has become a larger position in the Portfolio, it makes sense to explain the investment thesis in more detail.
For those who don’t care to understand the prescription drug value chain, feel free to skip over this section. While few readers may really care about the fairly complicated prescription drug value chain, it is important to review in order to understand the role that GoodRx plays within the ecosystem. This is my best attempt in trying to explain it in a few paragraphs.
Like many other parts of the U.S. healthcare system, prescription drugs suffer from complex and non-transparent pricing with access largely controlled by health plan payers. The majority of people in the U.S. have insurance provided by either their employer or a government program such as Medicare or Medicaid. Consumers largely rely on third parties to determine which drugs are covered by their health plan, and therefore which drugs may or may not be affordable.
Pharmacy benefit managers (PBMs) play a significant role and sit in the middle of three different parties. They are the intermediary between health insurers, pharmacies, and drug manufacturers. Health insurers hire PBMs to manage prescription drug plans for their covered population. PBMs negotiate on behalf of the health insurer with pharmacies. Pharmacies enter pricing contracts with PBMs in an effort to drive more demand to the store.
The contracts between PBMs and pharmacies determine the price a covered PBM member pays for any particular drug. There are two relevant prices: PBM’s negotiated MAC (maximum allowable cost) and Usual & Customary (U&C). MAC prices are the maximum price a PBM will pay a pharmacy for a generic drug. U&C are the cash prices set by the pharmacy that is charged to any uninsured customer not covered by a PBM.
Contracts between the PBM and a pharmacy state that the PBM will reimburse the pharmacy the lesser of:
- PBM’s MAC price
- Pharmacy’s U&C cash price
MAC pricing surrounds generic drugs, which make up nearly 90% of prescriptions filled in the U.S., but only account for ~20% of total drug costs. Branded drug pricing is typically set by the drug manufacturer and then PBMs may negotiate rebates or a discount from the list price for their covered members. For generics, PBMs will typically set a cap reimbursement rate (MAC price) for a specific dosage and form of a particular drug. The pharmacy then determines which generic version of the drug to supply among the different competing generic drug manufacturers.
An important part of PBM contracts is that the price a PBM reimburses the pharmacy cannot be lower than the U&C cash price set by the pharmacy. However, most pharmacies deal with multiple PBMs, and each PBM can have multiple, if not hundreds, of different MAC lists, one for each of the plans they manage. Therefore, MAC prices for any particular drug can vary significantly at any single pharmacy. This results in the pharmacy likely setting their general U&C cash price above the highest negotiated MAC price so they do not lose revenue.
Pharmacies cannot maintain multiple price schedules for PBMs or submit a different U&C cash price to a PBM than they would offer a cash customer without being in violation of their contract and at risk of being dropped from the PBM network. Therefore, U&C cash prices (the price uninsured consumers pay) are artificially elevated, sometimes reaching over 10 times the price of the pharmacy’s wholesale drug acquisition cost at extremes.
A greater share of the population is increasingly exposed to these inflated U&C cash prices. As healthcare costs have risen, so has the cost of insurance. Employers who have historically offered health insurance as a benefit are increasingly shifting the rising costs onto employees in the form of high deductible health plans (HDHPs). Over the last decade HDHPs have grown to ~50% of all commercial health plans and that number is expected to rise. Before someone with an HDHP hits their deductible, they usually have to pay the inflated U&C price for prescriptions. After the deductible is reached, they will typically have a copay or coinsurance. As more insured people are paying costs out of pocket and exposed to artificially inflated prescription prices, they are seeking affordable solutions to crucial products their health depends on.
Prescription Discount Cards
This is where GoodRx and other prescription discount cards come in. The PBM contracts with pharmacies allow PBMs to offer their negotiated MAC prices to people that are not covered insured members by providing them a discount code to use at the pharmacy. Consumers not covered by the PBM can access the PBM negotiated MAC prices as though they were patients within the PBM insurance network.
At the counter, the consumer using a discount code pays the MAC price to the pharmacy instead of the U&C cash price. The pharmacy would not submit a claim to the PBM since the consumer is not a covered member and is paying the full MAC price out of pocket. These prescriptions are not considered “cash-pay” since the transaction is processed by a PBM therefore are not in conflict with the U&C cash price contract provision. In exchange for the PBM processing the transaction, the pharmacy pays the PBM an administrative fee which the PBM then shares with the discount card vendor that directed the patient to them.
About a decade ago, a bunch of discount cash card companies entered into relationships with PBMs to access their network rates. Discount card companies would direct demand to PBMs, initially targeting the uninsured population who significantly benefited from accessing PBM MAC prices. PBMs benefit from access to a patient segment they otherwise would not have reached, the insurance company benefits by not paying a claim, and the patient pays a lower price than the U&C cash price or even the price offered by their insurance provider.
In the early days of these prescription discount card companies, it was largely a free-for-all greenfield opportunity that was difficult to differentiate. Discount cards were initially considered lead generators for PBMs. However, over the past decade GoodRx has emerged at the dominant leader of the pack. Rather than simply being a lead generator, GoodRx has built a consumer prescription marketplace that appears to have winner-take-most competitive dynamics.
GoodRx was successful for a few key reasons:
1. Established relationships with most of the PBMs early on which provided them access to the best MAC prices available on average. In 2014, GoodRx also patented the ability to contract with multiple PBMs and use its technology to show the lowest price for each pharmacy on a single interface. Being able to offer the lowest prices on average in a seamless customer friendly interface has resulted in GoodRx achieving a customer net promoter score (NPS) of 90.
2. Driving top of funnel consumer awareness. GoodRx created a user-friendly interface with healthcare professionals (providers/physicians) through web and app interfaces (NPS of 86). Doctors care about patient prescription adherence and GoodRx works with providers to help consumers better afford medication. It is integrated with the major electronic health record providers, allowing doctors to check prescription pricing while the patient is sitting in their office. Combined with targeted marketing, (~70% of consumers do not even know that prescription pricing varies significantly from pharmacy to pharmacy) GoodRx has accelerated consumer adoption of prescription discount cards.
3. Good relationships with pharmacies (point of sale). While pharmacies lose margin by having to accept PBM MAC prices for what may have been higher margin U&C cash prices, discount cards potentially increase foot traffic to their stores to buy other high margin consumer goods.
The above factors helped GoodRx in its early stages, but the creation of a prescription marketplace where PBMs compete with each other for demand on its platform is what will allow GoodRx to continue to succeed into the future. GoodRx has aggregated demand and now has the dominant and growing market share in the discount card space.
The details surrounding MAC pricing are opaque and subject to the private nature of PBM contracts, but industry insiders have stated that MAC prices are negotiated long-term average discounts to pharmacy prices. This pricing mechanism has an important implication that strengthens GoodRx’s position as the prescription marketplace winner. PBMs are able to provide more favorable pricing to certain members and less favorable pricing to others based on their negotiated average MAC prices. Since GoodRx has aggregated the most demand (7.5 million consumers for prescription-related offerings and reaches ~20 million Americans a month), a PBM can choose to be more price competitive on GoodRx in order to capture that demand. Even if a smaller discount card were able to partner with multiple PBMs, the PBMs are incentivized to price more aggressively on GoodRx to win the greater demand GoodRx has aggregated.
Competition
Among direct competitors that are solely prescription discount card providers, GoodRx is made up ~72% of web traffic and 75% of app downloads. GoodRx acquired RetailMeNot’s RxSaver in May 2021 which historically ranked second in Google Play and iOS store app downloads and monthly active users. RxSaver was also the only other major discount card provider that partnered with multiple PBMs.
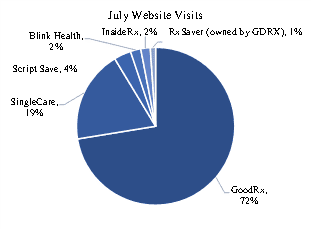
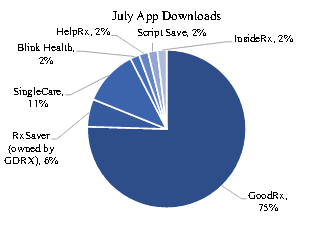
Source: SimilarWeb, Saga Partners
SingleCare and Blink Health are the next largest discount card providers measured by app downloads. Both work with only one PBM and negotiate pricing directly with pharmacies. SingleCare is about a quarter of the size of GoodRx and is integrated with its own PBM. Only working with one PBM removes any marketplace dynamic and makes it unlikely that prices through that provider will be the lowest available on average.
The major PBMs have their own prescription discount card but have had little traction because like SingleCare and Blink Health, are not a marketplace and therefore are unlikely to be able to offer the lowest prices for drugs all of the time. The largest PBM owned discount card is ScriptSave was a discount card acquired by MedImpact in 2013.
It is also important to understand the dynamics between discount card programs and pharmacies. Pharmacies have increasingly found themselves in a tough spot with little control over the prices they can charge customers, irrespective of their drug wholesale acquisition costs (cost of goods sold). Because the PBMs/payors have so much bargaining power over pharmacies in setting MAC prices, this leads to pharmacies earning near zero gross profit or even losing money on many prescriptions and then occasionally making significant profits on a small number of prescriptions from uninsured U&C cash paying customers. As prescription discount cards become more prevalent, pharmacies will no longer have the few very profitable U&C-priced prescriptions.
Chain pharmacies increasingly view fulfilling prescriptions as a loss leader driving foot traffic into their store to buy other higher margin products, such as groceries and cosmetics. It is similar to how most gas stations sell gas near breakeven to drive foot traffic and sell higher margin consumable products. Ellis Management Consultants released a consumer survey finding that every new prescription filled at grocery store pharmacies drove more than $40 of incremental sales in other departments. A recent GoodRx study found that half of consumers filling a prescription also purchased a secondary non-pharmacy item, with over half of those spending an incremental $11-$30.
Pharmacies have also tried to get around U&C pricing restraints by partnering with PBMs to offer their own prescription discount card. Costco and Walmart partner with MedImpact for their discount card programs. However, like the other PBMs and discount cards, they don’t benefit from GoodRx’s multi-PBM marketplace dynamic. Additionally, pharmacies also face a conflict of interest in promoting their discount card since they want customers to pay more at the counter and likely don’t prefer customers using their discount card at competing pharmacy locations.
Amazon made headlines in November 2020 when it launched Amazon Pharmacy, following its acquisition of PillPack in 2018. The launch was a combination of Amazon’s retail mail order pharmacy and a prescription discount card program called PrimeRx. At its core, Amazon Pharmacy is a pharmacy trying to increase consumer adoption of mail order prescriptions. Its discount card program is in partnership with Express Scripts and is the service that directly competes with GoodRx. It is likely that Amazon only introduced a discount card as a way for Amazon to publicly display third party drug prices for customers, which they wouldn’t be able to do otherwise. It is unlikely that Amazon is trying to send customers to competing retail pharmacies to fill prescriptions using Amazon’s prescription discount card. Third party surveys indicate that there has been almost no usage of PrimeRx thus far.
The fact that Amazon decided to partner with a PBM and to not directly discount drug prices shows how difficult it is to truly disrupt the prescription drug distribution channel. Disrupting supply chains by streamlining distribution to generate lower prices and a more customer-centric experience is what initially made Amazon successful, and its inability to do so in prescriptions is telling. Like all other pharmacies, Amazon depends on accepting insurance customers where PBMs determine the prices or a discount benefit program which also relies on PBM pricing.
The Shifting Prescription Drug Value Chain and Optionality
GoodRx’s success is attributable to the marketplace it built for consumers that works within the existing PBM and pharmacy networks. Creating a consumer-friendly experience that offers the cheapest prices most of the time is a big advantage that feeds its virtuous cycle. The more consumers GoodRx aggregates, the more PBM suppliers are encouraged to aggressively price on GoodRx to win more demand, which then attracts more consumers to GoodRx.
While the uninsured and high deductible plans all benefit from GoodRx prices, the prices available on GoodRx will increasingly become cheaper than copays and coinsurance. PBMs place drugs on different tiers within their formularies. If a prescription is on a higher tier or is a non-preferred drug, it can mean a higher co-pay or no coverage at all. Since GoodRx partners with nearly every PBM, they are able to get the best available pricing from the different PBMs in aggregate.
In 2017, the New York Times found that prices on GoodRx were cheaper than insurance copays ~40% of the time for the top 100 drugs. These prices also assume a customer already hit their deductible. In a June 2021 paper, GoodRx reported that over 55% of prescriptions filled using GoodRx were cheaper than the average commercial insurance copays for the 100 most purchased medications. The best discount available on GoodRx beat the average insurance copayment 89% of the time. The average discount on GoodRx has increased to 79% off list prices compared to 59% in 2016. This supports the thesis that as GoodRx scales, competition amongst PBMs is increasing and the pricing they offer on GoodRx is getting more aggressive and more favorable than the prices offered to insured customers.
GoodRx can increasingly serve more than just the uninsured and underinsured, which is reflected in the fact that 74% of GoodRx monthly active users have some form of insurance. While PBMs are benefitting from the incremental demand and associated administration fees paid by pharmacies, they will find they are losing their legacy power position within the prescription value chain as GoodRx is shining price transparency in a space that has historically been a black box. For the first time in recent history, PBMs are competing for demand that has become increasingly price sensitive as consumers carry more of the burden of healthcare costs. Even the three largest PBMs aren’t powerful enough to control drug pricing and GoodRx has become the aggregator within the prescription drug value chain.
GoodRx is also working directly with pharmacies through its subscription product GoodRx Gold. Subscribers pay a monthly fee to access even cheaper prices on 1,000+ prescription drugs at participating pharmacies. It also includes discounts on telehealth and access to mail delivery. It is clear management is putting a lot of resources into Gold and it will be an increasingly important product in the future. It’s possible to imagine GoodRx moving into a marketplace for other medical services and bundling things such as lab tests, x-rays, routine procedures, etc within Gold.
In 2020, an estimated $3.4 billion in U.S. prescriptions were transacted over the GoodRx platform, providing nearly $500 million in fees earned from PBMs. In 2021, these numbers are expected to grow to a respective $4 billion and $600 million. Total revenues are expected to pass $1 billion in 2022. As a marketplace, GoodRx has limited costs of supply, providing 90%+ gross profit margins. Sales and marketing are the largest operating expense at nearly 50% of sales. Management is targeting adjusted operating margins of over 40% at scale as sales and marketing costs decline as a percent of sales.
One may wonder how GoodRx, another middleman in what is already a crowded value chain, can earn so much money. It is a reflection of how inefficient the prescription market truly is. 20-30% of prescriptions go unfilled largely because of price, therefore GoodRx is expanding the market by offering lower priced drugs. Additionally, customers who paid inflated U&C prices are now able to utilize GoodRx to bring down the price. Insured customers can increasingly pay less money using GoodRx than using insurance, meaning insurance companies will not have to pay out claims. Paradoxically, GoodRx is lowering the cost of prescription drugs and still able to earn a lot of money.
GoodRx is only scratching the surface of the prescription market. Including the prescriptions that go unfilled, the total U.S prescription market is over $500 billion. Excluding specialty drugs, branded and generic drugs make up ~$350 billion; meaning prescriptions transacted over GoodRx consists of just over 1% of the market. In theory, if GoodRx continues to be successful in lowering drugs costs, prices will decline to their fair value removing this “arbitrage” opportunity that has been created by the PBMs and regulators (will save the history of U.S. health insurance and explanation of Medicare Part D for another day). If the cost of drugs declines because of greater market efficiency, then the total addressable market should also decline as inflated prices are removed. Note this does not consider other inefficiently priced health care services such as testing or routine procedures that would benefit from a marketplace and GoodRx could enter. Regardless, that market is still huge and if prescription drug prices were ever to become perfectly efficient, there will still be a demand for a platform like GoodRx. If GoodRx were to no longer exist, the inefficiency would return. As the prescription drug marketplace winner, GoodRx will be able to earn a fair take rate for providing that marketplace.
GoodRx is essentially the Bookings.com or Expedia.com of the prescription drug industry. The biggest difference is that the suppliers of drugs do not control the prices they can charge unlike airlines or hotels which are able to control the prices they charge. That means customers can’t disintermediate GoodRx by going straight to the supplier (the pharmacy) and paying the lowest available price. A prescription drug is essentially a commodity whose price is controlled by a third party, but absent a complete regulatory overhaul of the prescription industry, the only way efficiency and transparency can come to the market is through a platform such as GoodRx.
In a more perfect world, a GoodRx would not have to exist, but that is not the world we live in. PBMs act as the pipes of the prescription drug industry. Similarly, in a more perfect world Visa and Mastercard would not charge 2% for every transaction only to return most of it to the users in a rebate-like incentive. Ripping out the PBMs would be very difficult. There is risk of changes to the contracts between PBMs and pharmacies but those contracts are very complicated, difficult to unwind, and PBMs largely call the shots over pharmacies. If any PBM were to disadvantage GoodRx in any way, another PBM would likely be happy to jump in to access the growing demand that GoodRx has aggregated.
At the end of the second quarter, GoodRx was selling for 24x on an enterprise value to trailing gross profit basis and 17x consensus next twelve-month gross profits. Given that GoodRx has established itself as the winning discount prescription card, has a long runway to grow, and requires little incremental capital or costs to scale, these multiples appear very attractive in my opinion. If GoodRx continues to be successful in lowering drug prices and providing a great consumer experience, it is highly likely that the company will be worth a multiple of the $14 billion enterprise value it sold for at the end of the quarter.
Sold Teladoc (TDOC)
I discussed the Teladoc Health Inc (NYSE:TDOC) investment thesis in the last investor letter. It is unusual, at least I’d expect it to be unusual, that I explain a long-term thesis and then sell the stock shortly after. The Teladoc investment developed when our shares of Livongo were acquired by Teladoc last fall. Livongo was the industry leader in remote patient monitoring. It helped people, notably diabetics, manage their chronic condition through its connected devices, data analytics, and health nudges. Customer switching costs were higher as Livongo collected data on each of its members and provided personalized assistance based on each individual’s specific situation and needs.
With the acquisition of Livongo, Teladoc combined its ability to provide acute episodic care through its virtual telehealth platform (access to care when it is needed) and the ability to continuously monitor members (provide prevention, screenings, and chronic condition support). Together these pieces could potentially provide a more comprehensive “one-stop-shop of virtual healthcare” platform that enables Teladoc to be the virtual healthcare access point.
The ability to simply cross-sell Livongo throughout Teladoc’s large footprint provided an attractive opportunity. In addition, combining the leading remote patient monitoring and leading telehealth company to pursue the massive opportunity of virtual primary care presented additional optionality. There were some signs this may come to fruition, albeit anecdotal, when Teladoc piloted its virtual primary care model (Primary360) in 2019 with a 90+ net promoter score, although its future success was far from inevitable.
All that said, several factors changed which made me rethink my long-term conviction:
1. Management comingled Livongo and Teladoc results, specifically with its per member per month fee. This made it more difficult to analyze the operating results of the two major operating segments.
2. Several expert calls with former Teladoc employees potentially exposed a culture less geared towards innovation and delivering a superior patient experience and more focused on selling as many services as possible, similar to the dynamics within the traditional health system. They also revealed the difficulties that Teladoc had integrating previous acquisitions.
3. Glen Tullman and Hemant Tenaja, the founders of Livongo, left the Teladoc board and sold a significant percent of their shares only a few months after joining the board. Amar Kendale, Livongo’s Chief Product Officer was supposed to become Teladoc’s Chief Product Office but left Teladoc in May. Glen and Hemant stated they wanted to focus on other ventures, which seemed like a big shift from their message only a few months earlier. These departures, combined with the other senior Livongo managers not joining Teladoc increased the uncertainty surrounding the ability to successfully integrate Livongo.
While none of the above factors in and of themselves would have likely led to such a swift change in conviction, the combination of the three made me reconsider the long-term outlook. I came to the conclusion that the integration and execution risk was higher than previously expected and based on the increased uncertainty surrounding the long-term outlook, decided to reallocate the portfolio.
The Saga Portfolio’s average purchased price of Teladoc, adjusted for the acquisition of Livongo shares was $178 and average selling price was $166 for a 6% loss during our relatively short holding period. While these results are disappointing, losses are bound to happen when trying to make probabilistic expectations surrounding future outcomes.
I think it’s important that investors understand how portfolio decisions are made reflecting both the portfolio’s successes and failures. Successful investing is simply trying to see the world as clearly as possible with the information available today. It does not matter what price one paid for a stock historically or whether one has a gain or a loss on the investment (with a minor consideration for tax purposes). All that matters is to try to get as accurate of a picture of the future as possible with the information available today. When new information impacts the long-term outlook for the worse and there are relatively more attractive investment opportunities, it would be making another mistake to not reallocate due to previous expectations or anchoring to some arbitrary price point.
I still believe Teladoc has a lot of factors to help it succeed far into the future. It is the current leader in digital healthcare, a space with an inevitable tailwind at its back.
Purchased Redfin (RDFN)
Redfin Corp (NASDAQ:RDFN) is the first new company in the Saga Portfolio in 2021. Much of the proceeds from selling Teladoc were reallocated into Redfin during the second quarter. I’ll provide a short explanation and save a more detailed investment thesis write up for a later date given the growing word count of this letter.
Simply put, Redfin is a real estate broker. It uses its website and technology to remove friction from the process of buying and selling homes. Unlike traditional brokers that hire agents as contractors paid on commission, Redfin hires agents full-time to better realign incentives with customers. By utilizing its website as a top of funnel customer acquisition tool (4x more traffic than the second largest brokerage website), national brand advertising, and centralizing support functions, agents do not have to spend nearly as much time prospecting for demand. Redfin agents close three times as many transactions than the average agent at a traditional brokerage while charging half the industry standard fees, yet earn twice as much as the industry median agent pay. Redfin sells homes faster, for more money, and at lower fees while having a net promoter score consistently coming in above competitors.
Redfin is building a fully integrated brokerage service, leveraging its technology at every step of the home transaction from search, to booking tours, and innovative products such as Redfin Direct which allows a non-agent delivered offer. The company is trying to solve difficult problems in an industry that is due for disruption. It has all the factors that the Saga Portfolio looks for: an impressive track record of consistently gaining market share in a very large market, intense focus on improving the customer experience, and a transparent, shareholder-aligned CEO.
Updates
We’re excited to host our “fourth” annual meeting on Sunday, September 12. We say “fourth” as we had to cancel our third last year due to COVID. Our annual meeting is the best opportunity for us to speak directly with investors and answer any questions they may have. We hope to see everyone in person, but if you are not able to make it a recording will be made available.
We are also raising the minimum for new accounts to $250,000 starting Q3’21. We continue to have the privilege to grow with like-minded investors aligned with the Saga Portfolio’s philosophy. Having an investor base that is aligned, stable, and thinks long-term is truly a competitive advantage in the investment management industry. While we would like to be able to have a relationship with anyone that aligns with the Saga investment philosophy, we must realize that we do not have the capacity to maintain an infinite number of relationships and it therefore makes sense to raise the minimum as we grow.
It is truly an honor to manage our investors’ hard-earned capital. As always, please reach out if you have any questions or comments, I am always happy to hear from you!
Sincerely,
Joe Frankenfield
Appendix