In the age of NFTs, crypto, and Tesla valuation may seem passé. Though if history has taught us anything, it’ll become relevant again. When valuation appears to matter the least, it can be good to prepare yourself for a time when it will start to really matter. So, here’s how to value a company like a pro in five steps.
Q2 2021 hedge fund letters, conferences and more
All business starts with revenue. Revenue is the most important item in valuation, and if you get the revenue forecast wrong, you’ll get the valuation wrong. Revenue research happens outside the office, and critical questions to answer are:
- How many people are on the sales team?
- Who is running the sales team?
- What is the growth plan?
- What are the constraints to sales growth?
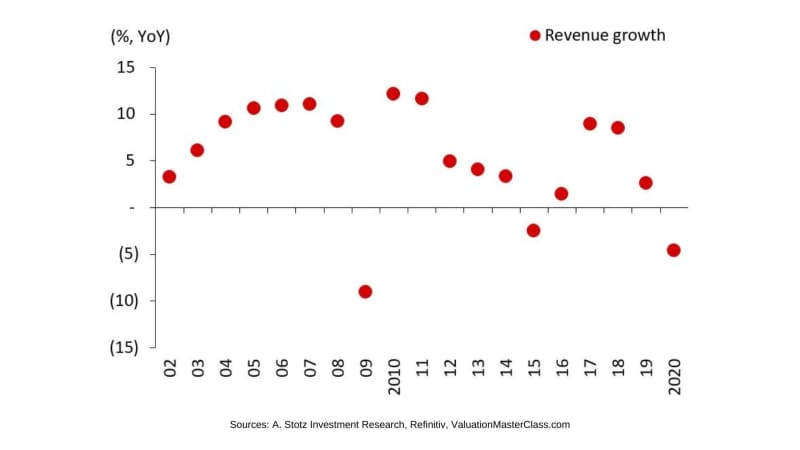
Revenue Grows On Average By 6%
In 2002-2020, revenue growth for all listed companies in the world averaged 6%, the fastest year was 2010 at 12%, and the slowest was 2009 at -9%. Forecasting by following short-term trends will not help, and no statistical tool can consistently, accurately forecast revenue growth.

To forecast revenue consider the company’s marketing and branding. Is market share rising? Has management done a market analysis? Does the brand clearly communicate the value?
To Forecast Revenue Consider The Company’s Products, Selling Process, And Service
What are the growth prospects for existing products? What new products will the company roll out? What are the bottlenecks in the sales process? Is the revenue scalable? Is there good follow-up with existing customers?
As the revenue forecast is essential for your valuation, spend most of your time in the valuation process on constructing it. Understand marketing, branding, products, selling process, delivery, and after-sales service, and don’t be overly optimistic.
Analysts commonly underestimate expenses and end up with an unrealistically high profit. We’ve studied the financial statements of about 15,000 companies to give you some guidance on how much of the P&L are costs. Cost of goods & services (COGS) is on average 71% of the company’s revenue, which means that for every $100 that the average company makes, $71 goes to cover COGS.
Five-Point-Six Percent
Can you guess what 5.6% refers to? That’s the average net profit margin for all companies in 2002-2020. These ratios differ across sectors and countries, but they give you an idea of a benchmark so you don’t underestimate a company’s costs.
Focus On COGS
Since COGS, on average, account for 71% of revenue, focus your forecasting mainly on revenue and COGS. Also, understand that significant changes in gross profit margin are unlikely. If you are forecasting substantial changes, then tell the story.
Many years ago, when I was a Head of Research, one of my analysts showed me a company forecast where the free cash flow to the firm (FCFF) jumped massively in the fourth estimated year. I looked into the details of the analyst’s projection and saw there was no Capex forecasted in years four and five, so I asked the analyst about it.
“The company only gave Capex guidance for the next three years,” he replied.
“Do you think the company is going to stop investing in its business?” I asked him rhetorically.
The analyst didn’t believe that the company would stop investing, and neither should you.
It Takes Investment To Grow Revenue
Therefore, it is generally unrealistic to forecast a company to grow revenue without growing its assets. I teach my students in the Valuation Master Class Boot Camp to avoid this mistake by looking at the asset turnover ratio to assure the asset forecasts keep pace with revenue. If the asset turnover ratio you forecast looks like in the chart below, you need to revise your forecast or have a story to tell.
The discount rate can be seen as the return the market demands in exchange for bearing the risk of that stock. If your discount rate assumption is too high, you will underestimate the company’s value. If your discount rate assumption is too low, your estimate of value will be too high.
Depending on your valuation method, your discount rate might be the cost of equity (COE) or the weighted average cost of capital (WACC). However, COE is part of WACC, and the COE generally has a more significant impact on the WACC than the other part, cost of debt.
Analysts Get Caught Up In The Components And Miss Their Real Task - To Use The Right COE
Various calculation methods and assumptions are used to “build” a COE; a standard approach to estimate the COE is the Capital Asset Pricing Model (CAPM). CAPM teaches that the COE is determined from the risk-free rate, the market risk premium, and beta, which supposedly reflects the premium related to the company-specific risk.
Think of these components as building blocks to arrive at your COE estimate. Unfortunately, analysts get lost in these components of COE and miss the big picture. The big picture is that the components don’t matter that much; what matters is that you arrive at the correct COE.
Yogi Berra Orders Pizza
The American professional baseball player, Yogi Berra, was not only an 18-time All-Star and won 10 World Series championships as a player; he was also super funny and insightful!
Once, Yogi Berra was at a restaurant and ordered a pizza when he asked:
“How many slices do you cut your pizzas in?”
“Six,” the waitress replied.
“You better cut the pizza in four pieces because I’m not hungry enough to eat six,” Yogi Berra replied.
The Cost Of Equity Is Like The Pizza Yogi Berra Ordered
There is an infinite number of ways to slice a pizza and the COE.

Think about the size of the pizza being the COE. It is not how you slice up COE that matters; getting the right “size” of COE matters, not the various slices.

As mentioned above, too high or too low COE can significantly change a firm’s fair value estimate, but be most wary of using a too low COE.
It is almost impossible for a firm to maintain a high level of profitability forever, neither to have losses forever. Therefore, fading return on invested capital (ROIC) down (or up in the case of low profitability firms) reflects the idea that firms can’t sustain excessive returns to infinity.
We analyzed about 11,000 companies in 10 sectors to understand how ROIC for a company changes over time. We performed this decay analysis by sorting firms into deciles and tracking the average ROIC for those 10 portfolios over 10 years. The findings are essential for valuation because they help us better understand how we should fade the ROIC during the fade period of the three-stage model.
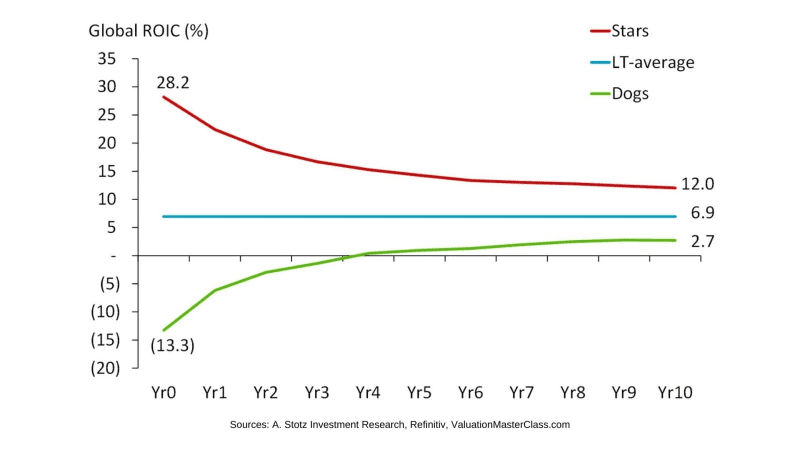
Fading ROIC to WACC reflects the idea that firms cannot sustain excessive returns to infinity. Very profitable firms decrease in profitability, and low profitability firms increase in profitability.
Bonus Step: YAAW
There’s a final lesson I want to share with you to value a company like a pro, and it’s YAAW. Finance is part art, part science. There is no “right” or “wrong” answer; only time will tell. It is impossible to be precisely right; in fact, you are always wrong (YAAW) to some extent.
Want More?
Join the Valuation Master Class Boot Camp – the only program that trains you exactly how to value actual companies like a pro and get your dream job in finance.
About the Author
In 1992 Dr. Andrew Stotz, CFA, left a management career at Pepsi-Cola in California to teach finance in Thailand. In 1993, he found his life calling as a financial analyst, a job for which he was eventually voted #1 in Thailand.
In the second half of his 20-year career in investment banking, Dr. Stotz was a Head of Research, leading teams of financial analysts. He served as a two-term president of CFA Society Thailand and now runs his firm, A. Stotz Investment Research, which provides research and tools for institutions and high-net-worth investors and helps CEOs make their companies financially world class.
Updated on