
Logica Capital commentary for the month ended July 31, 2022.
Summary
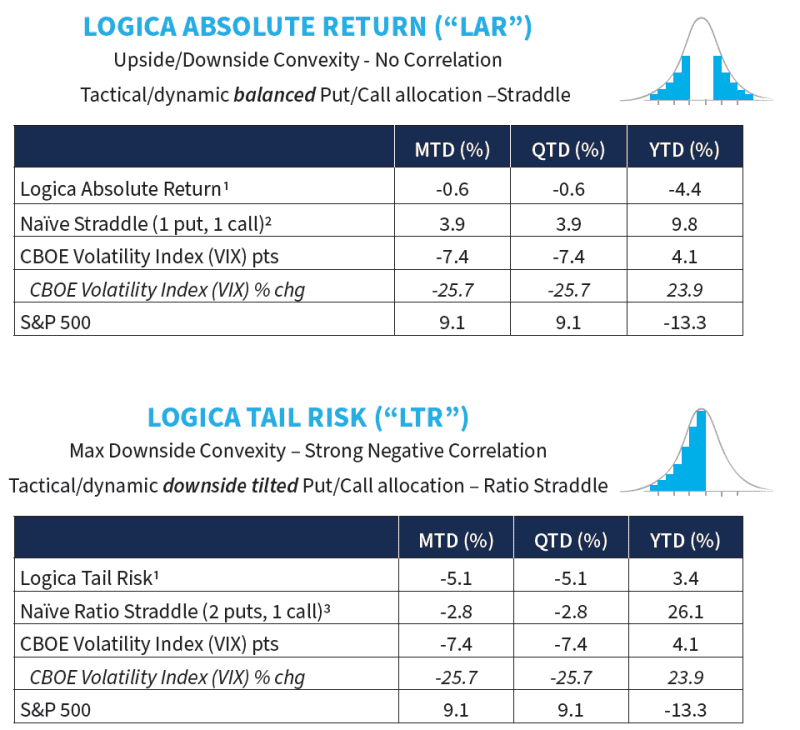
Market indices charged upward with vigor while VIX/Implied Volatility were decimated in July. We have seen much of the same behavior as the rest of 2022: long volatility holders are punished on market rallies, and relative to historical precedent, not rewarded on declines.
Logica Capital’s Commentary & Portfolio Return Attribution
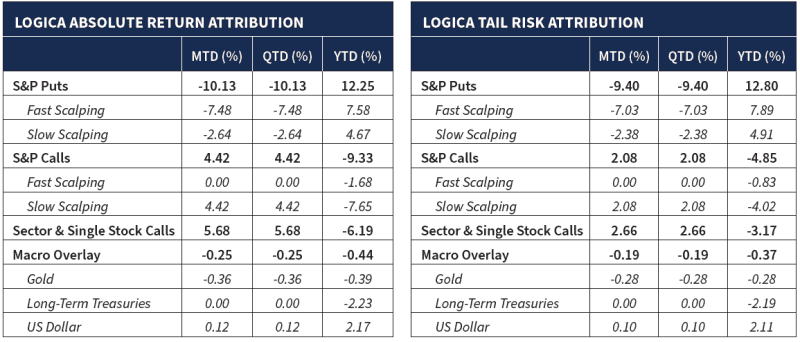
There weren’t many surprises this month in our attribution, with S&P Puts heavily detracting and Calls providing the up capture. We continued to see our Sector & Single Stock Calls underperform just a tad from monthly expectation, though on a YTD basis this module is still greatly outperforming the S&P 500 (down just -6.6% versus -13.3%). This is of course after the module equaled the S&P 500 return in 2021 (+27%). Given that, and other internal metrics/observations, we should again note that we’re confident that this module can continue carrying the flag for us – it’s a major differentiator and well-established source of alpha for us at Logica.
“I thought poker might be a perfect environment to start to learn probabilistic decision-making, and to live what it means to have skill versus chance and to see how that played out.” – Maria Konnikova
Separately, we find it worthwhile to briefly point to our benchmark, the naïve straddle. As shown above, our naïve straddle benchmarks have done well in both recent months and YTD. The main reason this occurs is because of rebalance timing. For clarity, we rebalance these internal benchmarks monthly, and it just so happened in 2022 that this has been a fairly ideal situation, as the S&P 500 has, perchance, abided nicely by a calendar schedule: large calendar down month followed by large calendar up month, etc… Had these moves happened mid-month, we’d see a very different outcome for a naïve straddle. Simply, the naïve straddle is far more path dependent.
And with path dependence, comes noise. The naïve straddle is noisy – and as such, we know that there will be plenty of time periods when the rebalance timing hurts it. More so, over the long run, these noisy outcomes should even out (S&P events have no substantive reason to honor the calendar!), whereas an active approach should shine. Further, it is important to understand that the active approach not only has a significantly higher hit rate (by virtue of the number of times “at bat” when scalping), but more importantly, maintains a materially larger protective position at all times.
To elaborate: as the naïve straddle moves in one direction over the course of a month, with a large move in the underlying, the moneyness spread widens significantly, as each side of the straddle accumulates delta (positive for calls, negative for puts). The active approach, on the other hand, is constantly re-striking. This means that if there were a 5% reversal near month end, the naïve, with so much “space” between ITM calls and OTM puts, would lose dramatically, whereas the active would not be very much different from its payout structure on the first days of the month, or for that matter, nearly any day of the month. This is the whole point of active management. In our view, tail risk strategies cannot be caught with so much long market exposure and should always seek to have a more protective stance.
“If you fell down yesterday, stand up today.” – H.G. Wells
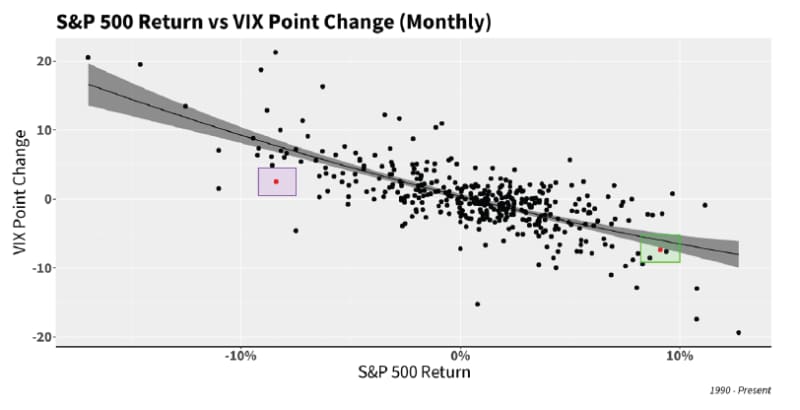
Checking in on the current state of the market, we turn back to the all-important graphic:
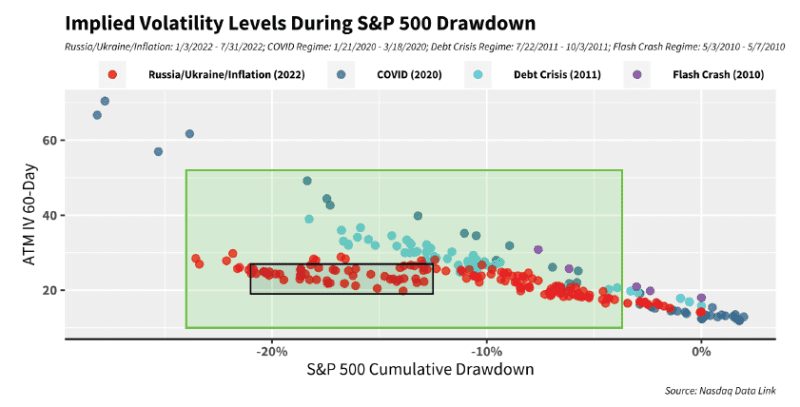
It should not be a surprise at this point: implied volatility simply continues to remain slightly elevated, but quite unresponsive to S&P decline, and as commented in prior letters (and as viewable above), responding in a very linear way versus the convexity we all expect from optionality.
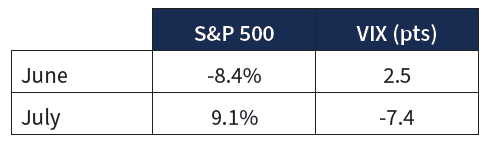
Yet, in July, we saw implied volatility being highly responsive to the S&P, but ironically, to S&P upside! In fact, this is easy to see because the S&P return for the month of July was almost exactly the opposite in magnitude of its return for the month of June. In short, the S&P, over two months, was close to flat, but VIX, on the other hand, crushed about 5 points. Here’s a quick view of the approximate symmetry of S&P 500 for June and July, vs the tremendous asymmetry of IV/VIX for the same periods:
In wanting to understand how reasonable – more so, unreasonable – this behavior is, we look at these monthly moves over a longer span of history, assessing VIX vs. the S&P each month for just over 3 decades (in the chart below). In this view, we see something very interesting, where the behavior for July was in fact quite normal, while that of June was the outlier. Specifically, the green box highlights July 2022 – a reasonably expected outcome for VIX given that the S&P 500 appreciated more than +9% (given that while the red dot is below, it is at least close to the line).
This is in stark contrast to June (the red dot in the purple box), where VIX did not pop near what our bestfit curve forecasted. For long volatility/tail risk, especially strategies like ours that do not simply let delta exposures naively accumulate/depreciate, this is, of course, far less than ideal.
“Those are my principles, and if you don’t like them… well, I have others.” – Groucho Marx
Looking at products/indices that use volatility as a hedge for a long position, we can see that the two we referenced last month have continued their lackluster 2022, highlighting the difficulty of long VIX call and/or long SPX put exposure.
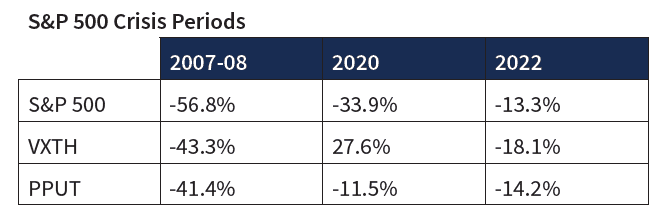
VXTH
- Buys and holds the performance of the S&P 500 index (the total return index, with dividends reinvested), and
- Buys one-month 30-delta call options on the CBOE Volatility Index (VIX). New VIX calls are purchased monthly, a procedure known as the “roll.” The weight of the VIX calls in the portfolio varies at each roll and depends on the forward value of VIX, an indicator for the perceived probability of a “swan event”.
PPUT
- The CBOE S&P 500 5% Put Protection Index (PPUT) tracks the value of a hypothetical portfolio of securities (PPUT portfolio) designed to protect an investor from negative S&P 500 returns. The PPUT portfolio is composed of S&P 500 stocks and of a long position in a one-month 5% out-of-the-money put option on the S&P 500 (SPX put).
- The PPUT portfolio is rebalanced monthly, typically on the third Friday of the month, when the SPX put expires. A new SPX put is then bought.
https://www.cboe.com/us/indices/dashboard/pput/
“Design is a funny word. Some people think design means how it looks. But of course, if you dig deeper, it’s really how it works.” – Steve Jobs
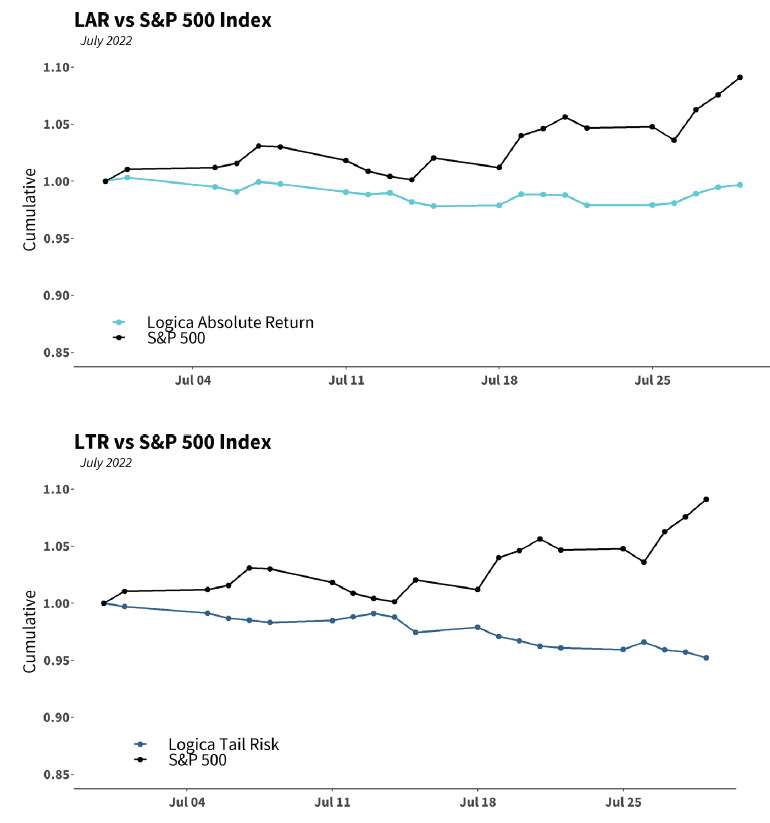
We have spent most of 2022 highlighting the year’s unusual volatility behavior, but we wanted to dive in a bit deeper to share how these behaviors (an S&P that has grinded downward without much response in Implied Vol) have so directly affected both LAR and LTR – even though the latter has performed positively on the year. More specifically, we wanted to get into the core design of the strategies, so as to illustrate exactly why this behavior makes it so challenging for them.
At a high level, and in line with Logica’s long volatility philosophy, we stay very clear of short volatility. In many other volatility strategies, short volatility is used as the primary mechanism for financing long volatility, e.g. through spread trading. At Logica, since we don’t short volatility to pay for our long volatility (literally, no spread trades), we require another means of “short vol” exposure in order to carry all that long Vol which is subject to constant bleed (theta). Our major issue with short Vol exposure (or spreads) is that they can directly counter-act the desired goals and objectives, creating a counter thesis payoff such that when one option spikes positively (as intended), the other spikes negatively, and all one gets is the net. To state the obvious, the short volatility leg is also convex, rapidly spiking in the exact “wrong” direction alongside the eagerly anticipated spike in the long leg. Thus, for us to impose a short Vol exposure that is not convex to being wrong, but concave to being wrong, we exchange short Vol option legs for long Vol calls (when equity markets go up, Vol tends to go down, hence “long market” is strongly correlated to “short vol” but without the convex counter-spike risk).
Accordingly, LAR is generally slightly long delta (positive tilted straddle, say 20-30% long the market) in order to pay for the excessive amount of S&P downside Puts that we own. And as such, when the market goes down, alongside Vol not going up, we get the downside from our minor long exposure as well as no pop from our massive long Vol exposure. If, on the other hand, Vol had popped nicely, as we’ve seen historically in many other corrections/drawdowns, then the net long exposure would very quickly and very likely be overtaken by the long Vol gain from Puts. For example, at VIX 60, we’d earn far in excess of the “cost” of our long market calls through the expected gain in long Vol. In summary, without the requisite Vol lift, we experience long exposure drag with market decline.
In stark contrast to LAR, our LTR portfolio contains only half the calls of LAR, and is almost without exception short delta, i.e., directly short the market with convexity. Hence, as S&P drops, LTR gains from its natural short tilt. That said, and similarly to LAR, it has not gotten much additional benefit from long Vol. In other words, if Vol had actually popped nicely (again, say VIX to 50 or 60), then LTR would be up far more, gaining from both the short market and the long Vol exposure. But in this case, it is merely just making money, almost linearly, from its natural short position (delta adjusted).
Thought of in a different way, LAR’s straddle exposure is analogous to the way “Market Neutral” strategies are not truly neutral. For example, in the market neutral world, one can be “dollar neutral” but have Beta exposure. Or one can actually be “Beta neutral” but have factor exposure, wherein the Beta assessment at this instant is zero, but given the market starts moving, then Betas change and the portfolio is suddenly not neutral (and, of course, Betas can be asymmetric relative to their sector/factor exposure such as growth/value; e.g. one’s tech stocks could increase in beta, while one’s consumer staples could decrease in beta). Said simply, even Beta neutral has risk of unstable Beta, or more broadly, basis risk from factor exposure.
Analogously with LAR and LTR, the basis risk is the association of Vol and SPX direction (or vega and delta, in options terms), where generally, negative delta (market down) is nicely offset by positive vega (Vol up); but if the market grinds down while Vol does not go up “enough” (refer to the “Implied Volatility Levels During S&P Drawdown” chart above), then our “beta neutrality” gets out of whack, and we are more long the market than we otherwise would be – and to boot, during a decline.
Finally, taking a look at the daily movement of our strategies for the month, we see LTR with a nicely negative correlation, and LAR generally uncorrelated over time. From the general shape of each, we can notice that, when implied vol crushes like it did in July, there is a “downward force” weighing on both strategies.
Updated on