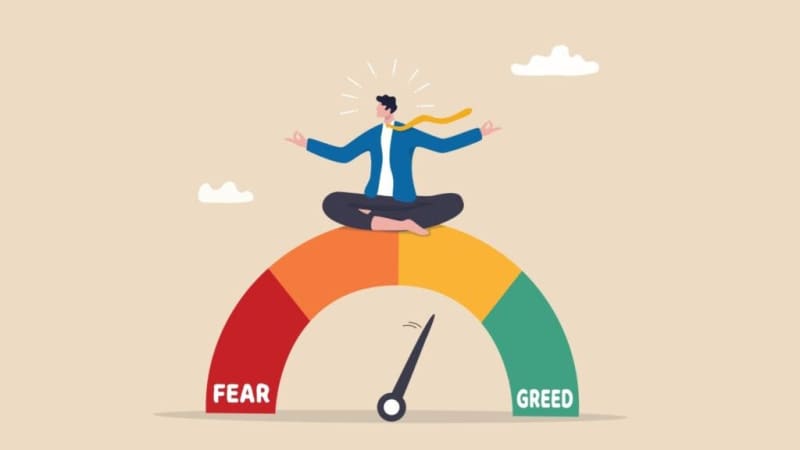
The CNN Money Fear and Greed index showed further improvement in the overall market sentiment, while the index remained in the “Fear” zone on Tuesday.
U.S. stocks closed higher on Tuesday, recording gains for the second straight session.
On the economic data front, the S&P Global composite PMI fell to 50.9 in April versus 52.1 a month ago. Sales of new single-family houses jumped 8.8% month-over-month to an annualized rate of 693,000 in March, compared to a revised 5.1% decline in February.
General Motors Company (NYSE:GM) reported better-than-expected earnings for its fiscal first quarter. PepsiCo Inc (NASDAQ:PEP) reported first-quarter FY24 sales growth of 2.3% year-on-year to $18.25 billion, beating the analyst consensus estimate of $18.079 billion. JetBlue Airways Corporation (NASDAQ:JBLU) shares fell around 19% on Tuesday after the company reported first-quarter financial results and issued weak FY24 revenue outlook.
As far as the earnings season is concerned, around 20% of the S&P 500 companies have released quarterly results so far, with around 76% of those exceeding market estimates.
Most sectors on the S&P 500 closed on a positive note, with information technology, communication services and industrial stocks recording the biggest gains on Tuesday. However, materials stocks bucked the overall market trend, closing the session lower.
The Dow Jones closed higher by around 264 points to 38,503.69 on Tuesday. The S&P 500 rose 1.20% at 5,070.55, while the Nasdaq Composite climbed 1.59% at 15,696.64 during Tuesday's session.
Investors are awaiting earnings results from Ford Motor Company (NYSE:F), AT&T Inc. (NYSE:T), The Boeing Company (NYSE:BA) and Meta Platforms, Inc. (NASDAQ:META) today.
At a current reading of 40.1, the index remained in the “Fear” zone on Tuesday, versus a prior reading of 38.1.
What is CNN Business Fear & Greed Index?
The Fear & Greed Index is a measure of the current market sentiment. It is based on the premise that higher fear exerts pressure on stock prices, while higher greed has the opposite effect. The index is calculated based on seven equal-weighted indicators. The index ranges from 0 to 100, where 0 represents maximum fear and 100 signals maximum greediness.
Read Next: Over $10M Bet On This Healthcare Stock? Check Out These 4 Stocks Insiders Are Buying
© 2024 Benzinga.com. Benzinga does not provide investment advice. All rights reserved.
