
Ratings for Gap (NYSE:GPS) were provided by 14 analysts in the past three months, showcasing a mix of bullish and bearish perspectives.
The table below summarizes their recent ratings, showcasing the evolving sentiments within the past 30 days and comparing them to the preceding months.
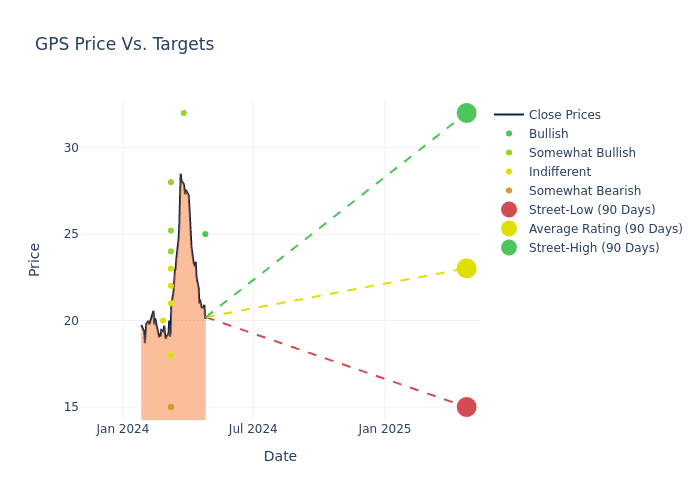
Analysts' evaluations of 12-month price targets offer additional insights, showcasing an average target of $22.8, with a high estimate of $32.00 and a low estimate of $15.00. This current average has increased by 15.44% from the previous average price target of $19.75.
Decoding Analyst Ratings: A Detailed Look
A comprehensive examination of how financial experts perceive Gap is derived from recent analyst actions. The following is a detailed summary of key analysts, their recent evaluations, and adjustments to ratings and price targets.
Key Insights:
- Action Taken: Analysts frequently update their recommendations based on evolving market conditions and company performance. Whether they 'Maintain', 'Raise' or 'Lower' their stance, it reflects their reaction to recent developments related to Gap. This information provides a snapshot of how analysts perceive the current state of the company.
- Rating: Gaining insights, analysts provide qualitative assessments, ranging from 'Outperform' to 'Underperform'. These ratings reflect expectations for the relative performance of Gap compared to the broader market.
- Price Targets: Analysts predict movements in price targets, offering estimates for Gap's future value. Examining the current and prior targets offers insights into analysts' evolving expectations.
Assessing these analyst evaluations alongside crucial financial indicators can provide a comprehensive overview of Gap's market position. Stay informed and make well-judged decisions with the assistance of our Ratings Table.
Stay up to date on Gap analyst ratings.
About Gap
Gap retails apparel, accessories, and personal-care products under the Gap, Old Navy, Banana Republic, and Athleta brands. Old Navy generates more than half of Gap's sales. The firm also operates e-commerce sites, outlet stores, and specialty stores under various Gap names. Gap operates approximately 2,600 stores in North America, Europe, and Asia and franchises more than 900 stores in Asia, Europe, Latin America, and other regions. Gap was founded in 1969 and is based in San Francisco.
Breaking Down Gap's Financial Performance
Market Capitalization Analysis: Falling below industry benchmarks, the company's market capitalization reflects a reduced size compared to peers. This positioning may be influenced by factors such as growth expectations or operational capacity.
Revenue Growth: Over the 3 months period, Gap showcased positive performance, achieving a revenue growth rate of 1.3% as of 31 January, 2024. This reflects a substantial increase in the company's top-line earnings. As compared to competitors, the company encountered difficulties, with a growth rate lower than the average among peers in the Consumer Discretionary sector.
Net Margin: Gap's net margin excels beyond industry benchmarks, reaching 4.3%. This signifies efficient cost management and strong financial health.
Return on Equity (ROE): Gap's ROE is below industry averages, indicating potential challenges in efficiently utilizing equity capital. With an ROE of 7.32%, the company may face hurdles in achieving optimal financial returns.
Return on Assets (ROA): Gap's financial strength is reflected in its exceptional ROA, which exceeds industry averages. With a remarkable ROA of 1.67%, the company showcases efficient use of assets and strong financial health.
Debt Management: The company faces challenges in debt management with a debt-to-equity ratio higher than the industry average. With a ratio of 2.1, caution is advised due to increased financial risk.
Analyst Ratings: Simplified
Analysts are specialists within banking and financial systems that typically report for specific stocks or within defined sectors. These people research company financial statements, sit in conference calls and meetings, and speak with relevant insiders to determine what are known as analyst ratings for stocks. Typically, analysts will rate each stock once a quarter.
Some analysts publish their predictions for metrics such as growth estimates, earnings, and revenue to provide additional guidance with their ratings. When using analyst ratings, it is important to keep in mind that stock and sector analysts are also human and are only offering their opinions to investors.
If you want to keep track of which analysts are outperforming others, you can view updated analyst ratings along withanalyst success scores in Benzinga Pro.
This article was generated by Benzinga's automated content engine and reviewed by an editor.
Latest Ratings for GPS
View More Analyst Ratings for GPS
View the Latest Analyst Ratings
© 2024 Benzinga.com. Benzinga does not provide investment advice. All rights reserved.