Shopify Inc. (SHOP) stock is still well off its 3-month highs, at $63.05 in morning trading on Monday June 10. This is still down 18.6% from $77.37 on May 6 before its May 8 earnings release. That provides an opportunity for value investors.
For example, SHOP stock could be up to $80 per share, or over 27% more based on its free cash flow. Shorting out-of-the-money puts as a disciplined way to buy in makes sense.
I discussed this in my last Barchart article on May 17, “Shopify Looks Cheap Based on Its FCF, and Shorting OTM Puts is a Good Way to Buy In.” I discussed selling short the $55.00 strike price put options that expired on June 7. That play ended up expiring worthless - a good thing for the short seller, especially if they already held SHOP stock.
For example, the investor immediately collected a 58-cent premium on that trade - a 1.05% yield (i.e., $0.55/$55.00) for every put contract sold short. Moreover, as SHOP stock was at $58.35, the long investor also made a 5.5% capital gain since SHOP stock closed at $61.59. So the total return could have been 6.59%.
SHOP Stock Still Looks Cheap
It makes sense to repeat this trade today. Again this is because the company is expected to produce between $8.5 billion and $10.5 billion in revenue in the next two fiscal years. Based on an assessment that its FCF margins could average 12.5%, that implies that its FCF could reach $1.06 billion and $1.29 billion in the next 2 years.
I discussed this in my recent May 16 GuruFocus article, “Shopify's FCF Margins Could Push It Higher.” Based on a 1.25% FCF yield metric, its market cap could rise to between $85 billion and $103 billion, or $94 billion on average.
That is at least 16% more than its $81.2 billion market cap today and could be as high as 26.8% more. In other words, SHOP stock could be worth 16% to 27% more, or $73 to $80 per share.
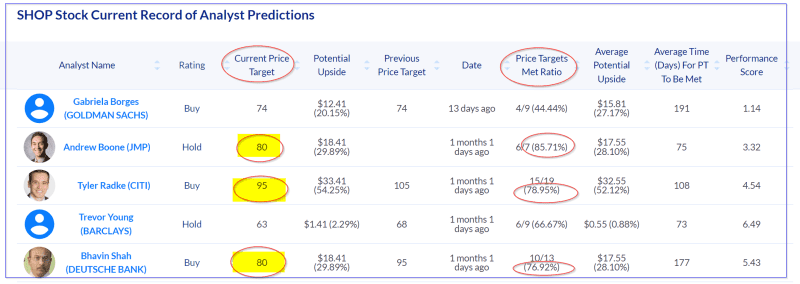
Other analysts agree. Yahoo! Finance shows that 40 analysts have an average price target of $75.51 per share. Moreover, Barchart's survey says 39 analysts have an average target price of $76.49. AnaChart.com, a new sell-side analyst tracking service, shows 36 analysts have an average $70.27 price target.
AnaChart reports that one analyst, Tyler Radke, of Citi, has a price target of $95 per share. He has been successful 78.95% of the time with his price targets having been met, according to AnaChart. Two other analysts, from JMP and Deutsche Bank, have an $80 price target (see below). They also have a high Price Targets Met Ratio from AnaChart.
That should give investors a good deal of confidence that SHOP stock is undervalued here. One way to play this again is to short out-of-the-money (OTM) puts, especially for existing investors.
Shorting OTM Puts
Look at the July 5 expiration period, 25 days from today. This shows that the $60 put strike price level has a premium of 90 cents. That strike price is 4.76% below today's $63 price and represents an immediate yield of 1.50% to the short seller of this put (i.e., $0.90/$60.00).
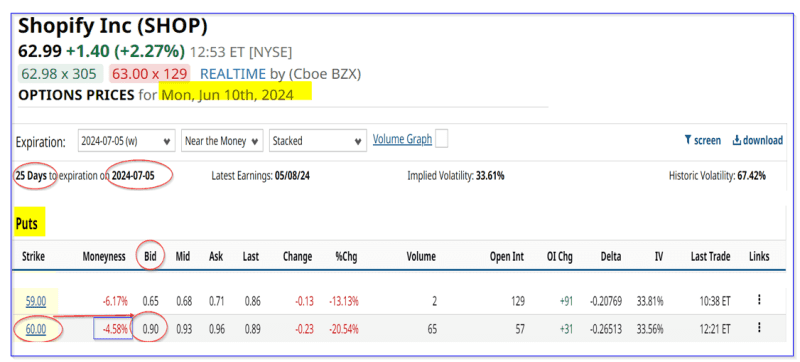
This means that any investor who secures $6,000 in cash and/or margin can enter an order to “Sell to Open” 1 put contract and immediately receive $90.00 in their brokerage account. Now the investor can already own SHOP stock as well. So, if the stock rises, they get both the upside and the income from this short sale.
But if the stock falls to $60.00 or lower on or before July 5, the investor's $6,000 will be used to buy 100 shares. That represents a disciplined way to buy into SHOP stock, even though there could be an unrealized loss.
However, keep in mind that the actual breakeven price is $60.00-$0.90 (from the income received), or $59.10. That is 6.19% below today's price. So there is good downside protection.
The bottom line is that Shopify stock looks cheap here. One way to play this is to sell short OTM puts in nearby expiry periods.
More Stock Market News from Barchart
On the date of publication, Mark R. Hake, CFA did not have (either directly or indirectly) positions in any of the securities mentioned in this article. All information and data in this article is solely for informational purposes. For more information please view the Barchart Disclosure Policy here.