During the COVID-19 pandemic, apparel brands like Lululemon Athletica Inc. (LULU) and Stitch Fix, Inc. (SFIX) were among the standout winners, as consumers gravitated toward LULU's athleisure vibe and SFIX's stay-at-home styling options. While both stocks are down from their pandemic highs, both LULU and SFIX are back on the radar, having rallied sharply after their most recent earnings reports.
Lululemon, renowned for quality athleisure wear, stands poised for success amid projections of the global athletic apparel market reaching $21.2 billion by 2032, expanding at a 3.1% compound annual growth rate (CAGR). Stitch Fix, famed for personalized styling services, could also prosper, given forecasts of the global custom apparel market expanding at a 6.4% CAGR, reaching $70.9 billion by 2028.
But which pandemic stock is poised for a comeback? Let’s find out.
The Case for Lululemon Stock
Vancouver-based Lululemon Athletica Inc. (LULU) designs and sells athletic apparel, footwear, and accessories for women and men. Founded in 1998, Lululemon offers a range of products, including pants, shorts, tops, and jackets, primarily targeting customers interested in healthy lifestyle activities such as yoga and running. With a market cap of $40.1 billion, Lululemon operates globally, selling through company stores, outlets, online platforms, and various partners, reaching customers in the U.S., Canada, China, and beyond.
After a major pandemic-era surge, LULU stock has declined 34.8% since its November 2021 peak of $485.82. Moreover, the stock is down 38.4% from its all-time high of $516.39, achieved in late December last year.
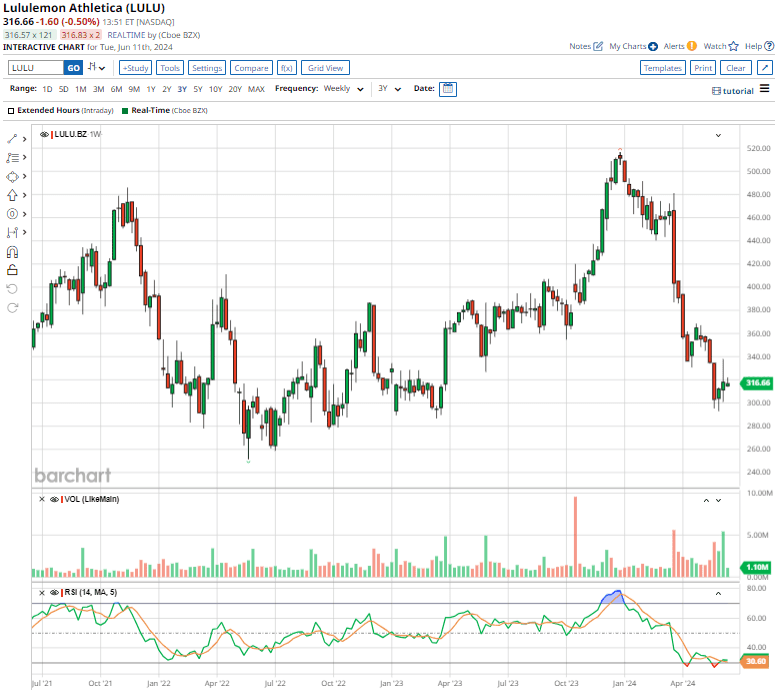
Priced at 22.74 forward earnings and 4.23 times sales, the stock trades at a premium to the apparel retail industry median, but at a discount to its own five-year averages.
Lululemon Beats Q1 Earnings Estimates
Lululemon stock surged 4.8% in the subsequent trading session after reporting stronger-than-expected Q1 earnings results on June 5. Revenue jumped 10% year over year to $2.2 billion, with women's sales up 10% and men's up 15.4%.
U.S. revenue edged up 2%, while international sales soared 35%, led by a 44.6% spike in China. Strong China business helped buffer a slowdown in consumer spending on pricey tank tops and leggings in its key North American market. EPS jumped 11.4% to $2.54, beating forecasts by 6.7%.
Lululemon’s Pandemic Boom
During the pandemic, Lululemon thrived as athleisure became the new norm, with cozy yoga pants and shorts replacing office wear. Despite temporary store closures, Lululemon's sales skyrocketed to $6.3 billion in fiscal 2021 and soared to $8.1 billion in fiscal 2022, driven by a surge in online shopping. The shift toward home workouts and active lifestyles perfectly aligned with Lululemon's core offerings.
Lululemon embraced its “Power of Three” strategy, prioritizing product innovation, enhancing guest experiences, and market expansion. Its agility in adapting to the digital landscape and dedication to quality and innovation kept customer connections strong despite physical store closures.
Post-Pandemic Growth
Even after the dust settled on the pandemic era, Q1 digital sales at LULU contributed $906 million and accounted for 41% of total revenue.
Lululemon harnesses local engagement, community activations, and brand campaigns to draw new visitors to its stores and online platforms. With a robust membership program of 20 million in North America, exclusive perks like early product access and special events deepen member involvement, boosting spending and loyalty.
Looking ahead, Lululemon forecasts fiscal Q2 revenue between $2.40 billion and $2.42 billion, with adjusted EPS projected between $2.92 and $2.97. For fiscal 2024, revenue is expected to range between $10.7 billion and $10.8 billion, with adjusted EPS ranging from $14.27 to $14.47.
What Do Analysts Expect for LULU?
Analysts tracking Lululemon expect its fiscal 2024 EPS to grow 11.6% year over year to $14.25 and climb another 10.3% in fiscal 2025 to $15.71.
On June 6, HSBC upgraded Lululemon Athletica from a “Hold” to a “Buy” rating, with a target price of $425. The firm said investors have “overly punished” the stock, which now looks undervalued. Analysts at BTIG and TD Cowen also raised their respective price targets on LULU after earnings.
Lululemon stock has a consensus “Moderate Buy” rating overall. Out of the 26 analysts covering the stock, 16 suggest a “Strong Buy,” three recommend a “Moderate Buy,” five advise “Hold,” one recommends a “Moderate Sell,” and the remaining one gives a “Strong Sell” rating.
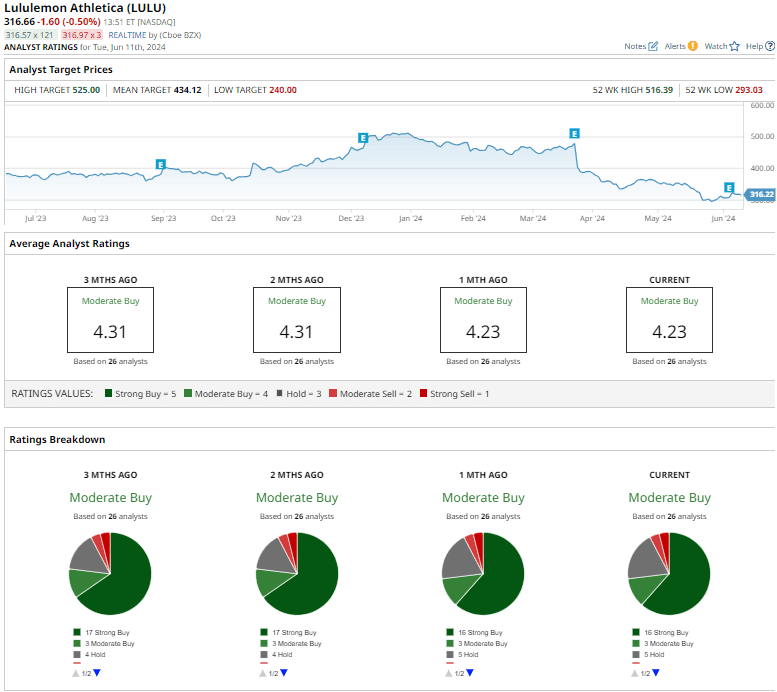
The average analyst price target of $434.12 indicates a potential upside of 37.2% from current price levels. However, the Street-high price target of $525 suggests LULU stock could rally as much as 65.8%.
The Case for Stitch Fix Stock
With a market cap of $459 million, San Francisco-based Stitch Fix, Inc. (SFIX) specializes in personalized apparel and accessories, catering to men, women, and kids across the U.S. and U.K. via its online platforms. Known for its subscription-based model, customers can receive curated selections and return items as needed, addressing a key consumer pain point.
As it evolves, the company has focused on refining its marketing strategies and enhancing client interactions, aiming to foster greater customer engagement, as client retention has become a post-pandemic pain point for management.
After a major pandemic-era surge, the personalized clothing company stock has faced a steep decline since its January 2021 peak of $113.76. SFIX is down 96.6% from that high and 26.5% from its 52-week peak of $5.20, achieved last July.
Despite a 13.4% dip over the past year, Stitch Fix shares have climbed 8.7% on a YTD basis and 84.8% over the past month. This surge was fueled in part by an impressive two-day rally of 42.3% following the company's fiscal Q3 earnings results earlier this month.
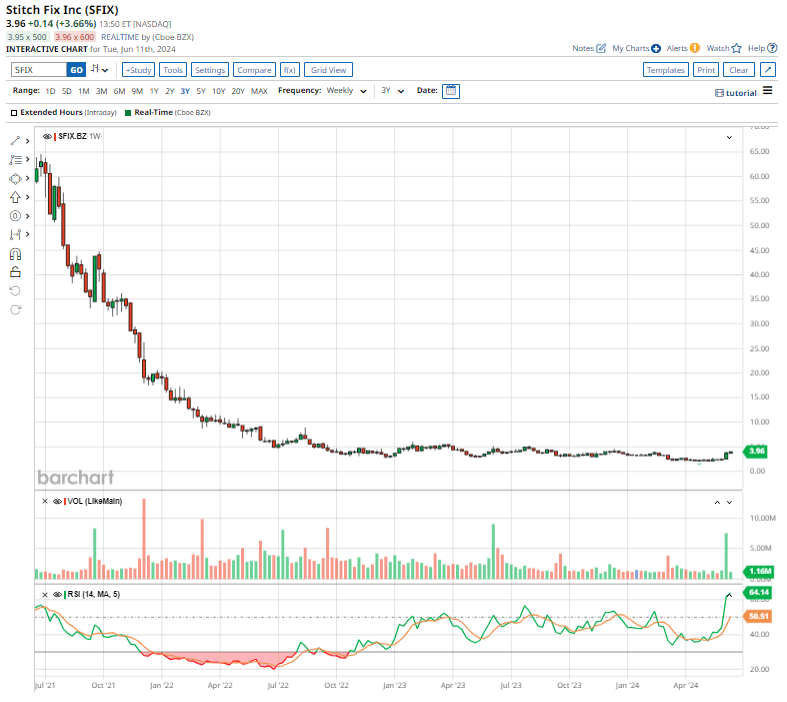
Priced at 0.28 times sales, the stock trades at a discount to its industry median of 0.91x and its own five-year average of 1.18x.
Stitch Fix Beats Q3 Estimates
Following the Q3 earnings results unveiled on June 4, the apparel company’s shares soared 29.4% in the subsequent trading session, thanks to the better-than-expected top- and bottom-line figures. Stitch Fix reported an adjusted $0.15 loss per share on revenue of $322.7 million, surpassing projections for a $0.25 per share loss on revenue of $306.2 million.
The company's gross margin reached 45.5%, marking its best quarterly performance in more than two years. Despite these positive surprises, its loss per share expanded 12.5% annually, while revenue dropped 15.8% year over year.
Pandemic Peaks and Post-Pandemic Challenges
Stitch Fix hit a high with over $2.1 billion in sales in fiscal 2021 and 4.2 million active clients, riding the pandemic wave and adapting swiftly to changing customer needs. By fiscal 2023, however, sales dipped to $1.6 billion, and active clients tumbled to 3.3 million as the pandemic's influence waned.
With pandemic tailwinds normalizing, the company faces a massive challenge in retaining its client base. Active clients decreased in Q3, down 6% sequentially and 20% from last year. However, those staying are spending more, with net revenue per active user up 2% year-over-year.
To combat client declines, Stitch Fix is enhancing unit economics and planning client experience updates. Its Q3 free cash flow totaled $18.9 million, with Stitch Fix ending the quarter debt-free and holding $244.5 million in cash, cash equivalents, and investments.
In Q3, Stitch Fix sharpened its edge with AI and a unique business model, enhancing profitability and client satisfaction. Leveraging deep client insights and data science, the company optimized operations and slashed underperforming shipments. Proprietary algorithms boosted quick-fix order values by 25% in just three weeks. A strategic pricing review uncovered a $20 million profit opportunity, while new promotions and scaled AI tools aim to amplify inventory productivity and tailor styles to perfection, driving continued customer engagement and business growth.
Stitch Fix expects Q4 revenue between $312 million and $322 million, a slight drop from Q3. Adjusted EBITDA is projected to range between $5 million and $10 million, with margins expected between 1.6% and 3.1%. The company expects full-year revenue to range between $1.33 billion and $1.34 billion.
What's the Analyst Forecast for SFIX?
Analysts tracking Stitch Fix expect the company’s loss per share to narrow by 31.3% to $0.79 in fiscal 2024, with further improvement to a loss of $0.66 per share in fiscal 2025.
Unimpressed by the better-than-expected Q3 results, Seeking Alpha analyst Michael Wiggins De Oliveira criticized Stitch Fix as a "dying business." With negative year-over-year growth persisting for eight quarters, De Oliveira seems to think most of the upside potential for SFIX comes from a short squeeze.
Analysts are cautious about Stitch Fix stock, which has a consensus “Hold” rating. Out of the 13 analysts covering the stock, 11 suggest a “Hold,” and two advise a “Strong Sell” rating.
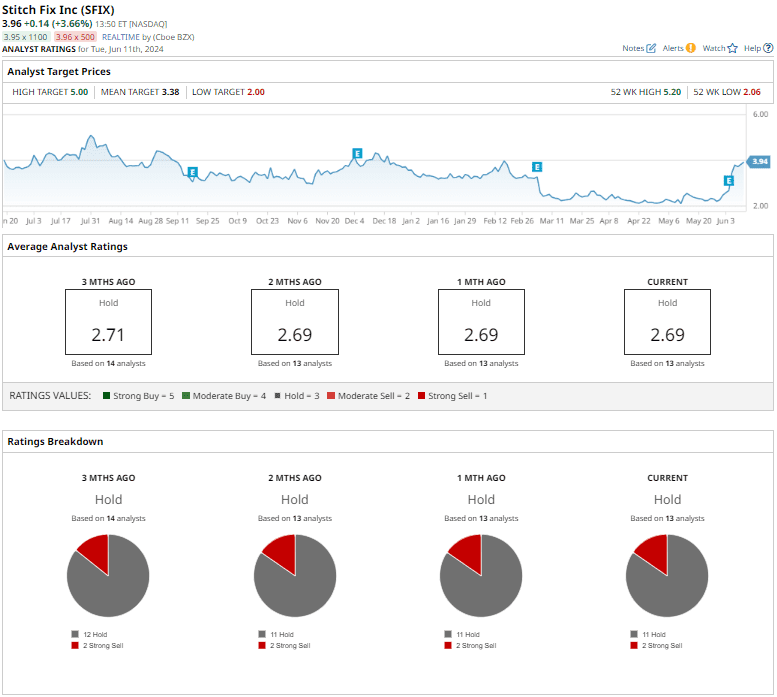
The stock is trading above the average analyst price target of $3.38, but the Street-high price target of $5 suggests that the stock has an upside potential of 26.3% from its current price levels.
LULU vs. SFIX: Which Stock Looks Primed for a Comeback?
Both Lululemon and Stitch Fix have ceiling to run higher, with the post-earnings rally in each suggesting the beaten-down apparel stocks have lots of room to surprise investors to the upside
While both companies thrived during the pandemic, Lululemon appears to have the more durable post-COVID business model, with sustained profitability and revenue growth, whereas Stitch Fix is struggling to retain clients. This makes Lululemon the stock that looks better positioned for a comeback, thanks to its solid metrics, innovative strategies, and strong international sales.
On the date of publication, Sristi Suman Jayaswal did not have (either directly or indirectly) positions in any of the securities mentioned in this article. All information and data in this article is solely for informational purposes. For more information please view the Barchart Disclosure Policy here.