
As a new quarter approaches, investors are eager to see if fresh capital will flow into the stock market. With economic indicators showing mixed signals and the Federal Reserve pausing, market participants closely watch for signs of renewed investment.
Will the promise of cooling inflation and a potential easing cycle by the Fed entice more money into the markets, or will consumer fatigue and unequal wealth distribution dampen enthusiasm?
As the second quarter ends this week, investors will be eager to see if the bull market will continue into the third quarter. Looking at the S&P 500 (SPY) performance, the YTD returns have reached 15%. With one week remaining for the second quarter, the SPY has returned slightly better than 4%. Compared to the first quarter, the return was about 11%.
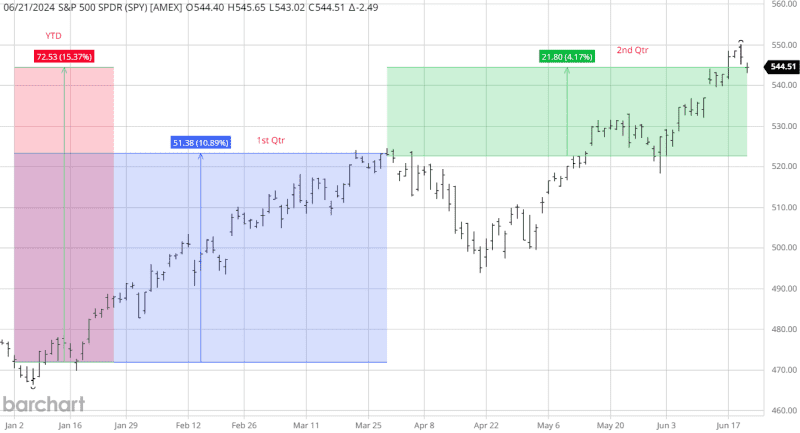
Source: Barchart
Technically, the SPY still looks bullish, while the uptrend remains intact. Internally, market pundits continue to find reasons for the market to turn down.
One report explains that the declining short interest makes the market vulnerable to a downturn. The excess tech buying and sentiment have some concerns that the market needs a sideways or corrective move. There is never a shortage of contrarian thinking regarding the markets.
While these arguments may have some validity, the fact is that the market continues to move higher. The market will eventually turn down, but timing the top of a bull market can leave investors and traders with smaller financial accounts.
In a recent article for Barchart, "Nasdaq Market Has Perfect Bullish Historical Pattern – Don't Sell in May!" I wrote, "Sell in May and come back after Labor Day," is a well-known adage in the stock market that suggests investors should sell their stock holdings in May and return to the market after Labor Day in September. But, like so many market clichés, sayings that aren't supported by historical data are meaningless. An example is the upcoming Nasdaq seasonal buy with a perfect historical 15-year record."
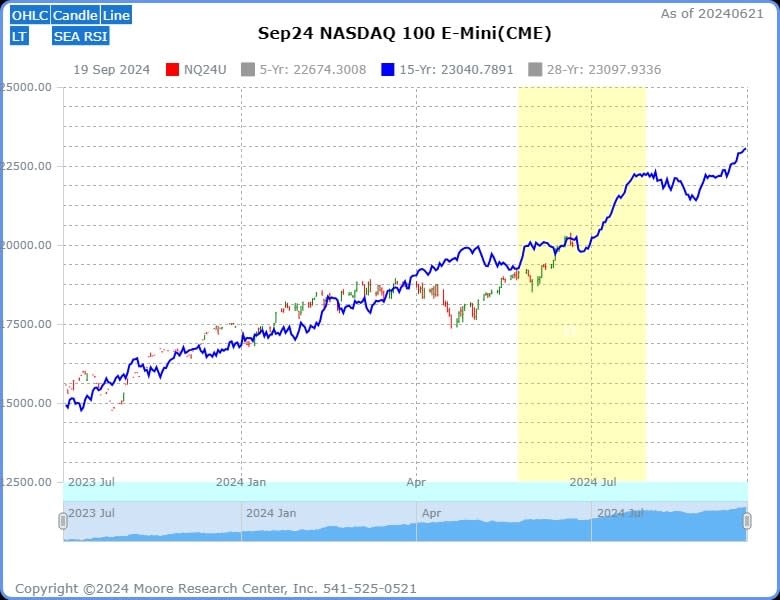
Source: Moore Research Center, Inc. (MRCI)
An updated chart after the optimal seasonal buy window began shows the Nasdaq futures were up nearly 32% before the recent market pause. The stock index correlations are high enough that these substantial seasonal opportunities can impact all of them. As the market maxim goes, "A rising tide raises all ships."
Supporting this stock index's bullish seasonal window is another window for lower interest rates, significantly supporting higher stock prices. In other articles for Barchart, " Long-Term Yields Poised to Fall – Lower Mortgage Rates Near" and "Seasonal Downtrend in Interest Rates Gains Momentum," I discussed the seasonal pattern for lower interest rates between May and the end of August each year.
Bullish Pattern?
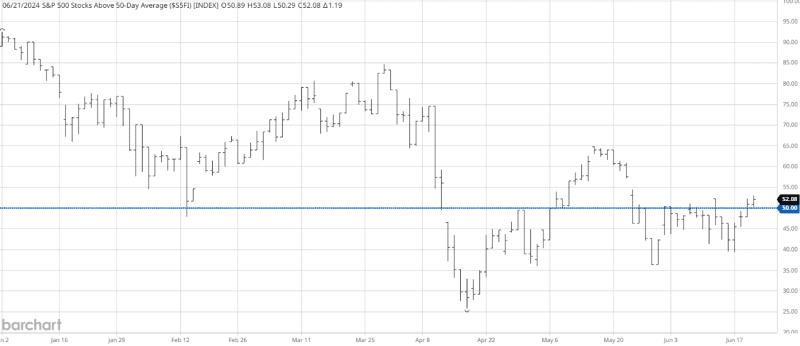
Source: Barchart
A popular study detailing the internal strength of the S&P 500 is the number of stocks in the index above their 50-day moving average. The indicator under 50% can reflect weakness as more than half of the S&P 500 stocks are trading under their 50-day moving average and show strength when trading over 50%. You can find this study on Barchart using the symbol "$S5FI."
Last week's performance saw the indicator close above the 50% line for two consecutive days.
Will this lure in more bullish sentiment as we close out this week's second quarter?
Seasonal Pattern
While the Nasdaq is enjoying a recent bullish seasonal buy window, the Dow Jones also has an opportunity to shine. With a bullish tailwind from lower interest rates into August, the Dow Jones has a similar seasonal buy.
It's important to note that while seasonal patterns can provide valuable insights, they should not be the sole basis for trading decisions. Traders must consider other technical and fundamental indicators, risk management strategies, and market conditions to make well-informed and balanced trading choices.
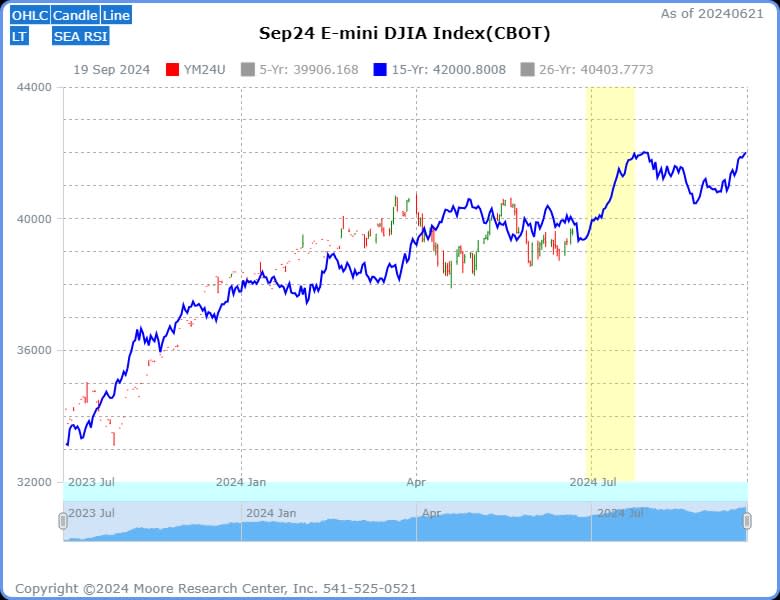
Source: MRCI
MRCI research has found that the Dow Jones has a historical rally record during the above seasonal window (yellow bar.) The blue line is the 15-year average of prices. Their research details that the Dow Jones closed higher on about July 23 than on June 28 for all 15 of the past 15 years, a 100% historical pattern. The dates for this rally align with the beginning of the third quarter when new money has been put into the market historically. Also, there is an alignment with the lower interest rate seasonal pattern that usually supports the stock market.
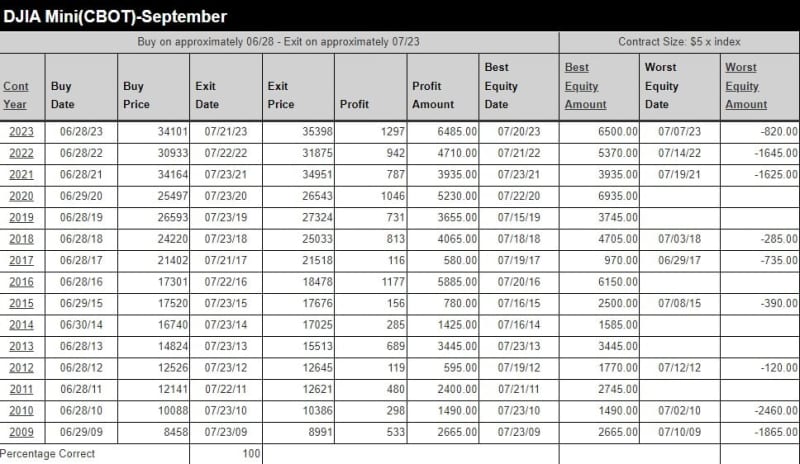
Source: MRCI
MRCI research finds seasonal patterns with historical good returns and minimal drawdowns. After reviewing the past 15 years of this pattern, I found that six of the years never had a daily closing drawdown.
In closing
As the second quarter ends, investors eagerly anticipate whether fresh capital will flow into the stock market in the new quarter. Despite mixed economic signals and a Federal Reserve pause, the S&P 500 (SPY) has shown strong performance with a year-to-date return of 15%. However, concerns about consumer fatigue and unequal wealth distribution linger.
Technically, the market remains bullish, though some analysts warn of potential vulnerabilities. Historical data suggests the Nasdaq and Dow Jones may benefit from seasonal buy windows and lower interest rates, indicating possible continued gains. While these patterns offer optimism, investors should balance them with technical and fundamental analysis to make informed decisions. As the new quarter begins, all eyes will be on the market to see if the bull run persists.
More Stock Market News from Barchart
On the date of publication, Don Dawson did not have (either directly or indirectly) positions in any of the securities mentioned in this article. All information and data in this article is solely for informational purposes. For more information please view the Barchart Disclosure Policy here.