
A Cyclical Correction Looks “Priced into The Market”
The economic headlines last week were anything but reassuring, yet stocks rose anyway. It can be a challenge for investors to make sense of why stocks rally in the face of missed earnings and, in some cases, lower guidance. But time and time again, a big drop in stock prices typically precedes a tsunami of bearish data followed by a rally in the averages ahead of the headlines and data turning positive again.
Q2 2022 hedge fund letters, conferences and more
This mental dilemma can make it difficult to pull the trigger and raise exposure to equities when it seems counter-intuitive to do so. This past week, initial jobless claims rose to the highest level since November. Existing home sales fell for the fifth straight month to a level 14% below a year earlier. Housing starts and building permits both fell to their lowest levels since September and manufacturing data from the Philadelphia Fed survey dove further into negative territory, reflecting a sharp drop in new orders in July.
Here are some more specific conundrums, when you consider price action vs. recent headlines:
- If business conditions are so soft in the housing market, why did shares of the SPDR S&P Homebuilders ETF (NYSEARCA:XHB) rally 21% off their June low?
- If growth in the job market is about to hit pause, per the rising weekly claims data, then why are shares of Automatic Data Processing Inc. (NASDAQ:ADP), the biggest staffing and employment services company in America, trading 10% higher than the June low?
- If the biggest chipmakers in the world are collectively stating that they are reducing their capex spending on new equipment, then why did the VanEk Semiconductor ETF (NASDAQ:SMH) vault 19% higher since it plumbed a yearly low on July 2?
- And if manufacturing is tanking, per the Philly Fed report, then why did we see a 10% jump in shares of the Industrial Select Sector SPDR ETF (NYSEARCA:XLI) this past week?
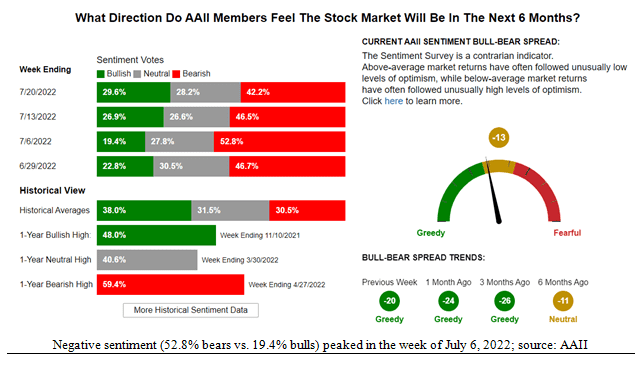
The most logical answer to all of these questions is that investor sentiment had anticipated these events and had bottomed out as of the first week of July, and has been gradually improving over the course of the month, according to the most recent data from the American Association of Individual Investors.
While these sentiment numbers (below) are still well under the historical averages, this noted contrarian indicator registered extreme bearishness during the week of July 6 with 52.8% of those surveyed saying they expected the market to decline further over the next six months vs. only 19.4% seeing a rise. This was the same week the CBOE Volatility Index (INDEXCBOE:VIX) was much higher, at 35.0, while today it sits at 23.0.
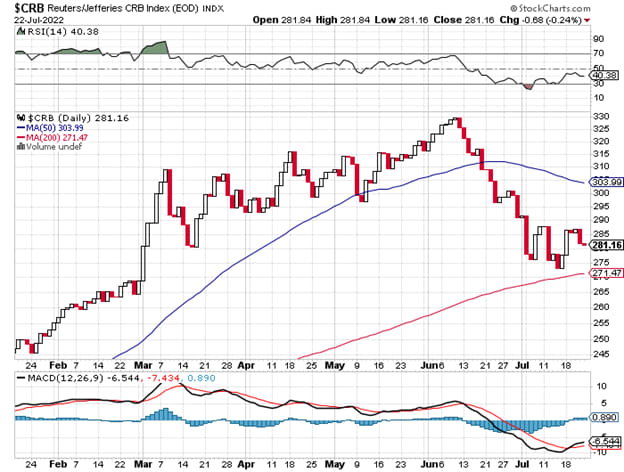
Maybe the Fed will get its wish and see the rate of inflation decline sharply in the second half of this year. As the chart (below) shows, the CRB Index (CRB), which measures the prices of 17 global commodities, has fallen 14.8% from its early June high, reflecting a sharp pullback in the price of oil, which is now being reflected in lower gasoline prices – the latest AAA national price for gas being $4.38 per gallon.
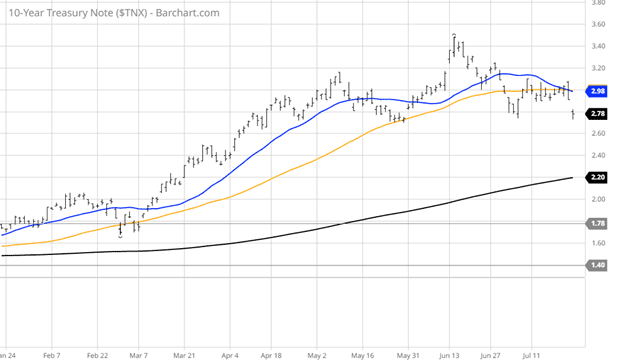
In a more telling sign of what may come to pass, Treasury yields plunged in reaction to recent economic data, with the 10-year T-Note yield closing the week at 2.78%well below the 3.50% peak in early June, right around when the market hit its low for the year followed by the spike in bearish sentiment. From the chart below, this move lower in yield is a notable break in what had been a steady uptrend for the 10-year.
The yield curve remains inverted and the bond market is implying that this week’s rate hike might be the last, despite the almost uniform agreement that another rate hike in September is imminent.
With last week's sudden move down in yield, that assumption is being called into question.
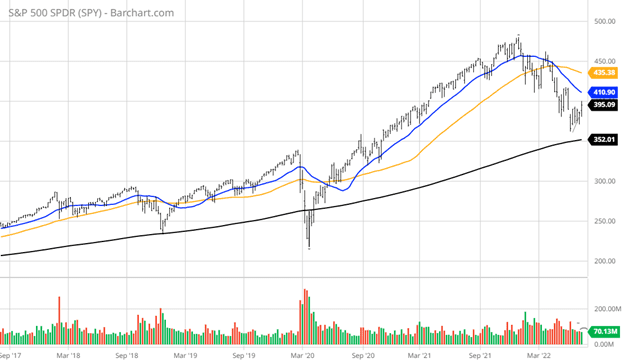
A look at the 5-year chart of the S&P 500 SPDR ETF (NYMARKET:SPY) shows that the long-term primary bull trend line comes into play just above $350 (or 3,500 for the S&P 500 index). This line sits 11% below where the market closed Friday last week. Depending on the tone of forward guidance by the S&P companies yet to report second-quarter earnings, it stands to reason this line will hold.
Given the price action of the past week,the market has sent a message that it might be time for investors to switch from selling into rallies and instead resume buying great stocks on any pullbacks.
From early second-quarter reports, it is very clear that inflationary forces, global logistical bottlenecks, Covid, and the strong dollar are material headwinds for many companies. But one theme keeps showing up from the leading companies that have reported their numbers – demand for their goods and services is healthy. America’s leading truckers and railroads are reporting solid demand, as are airlines and lodging firms. Steel producers posted record profits and gave an upbeat outlook as did energy services companies.
It seems clear at this point that economic growth is slowing, but a recession is looking less likely, at least one of any significance that will derail the stock market from violating its long-term uptrend line.
Navellier & Associates Inc. does not own Automatic Data Processing Inc. (ADP) in managed accounts. Bryan Perry does not own Automatic Data Processing Inc. (ADP) personally.
Updated on