
Another Federal Reserve Board meeting has left the Fed Funds rate unchanged at 5.25 to 5.50%. Due to inflation's stickiness being higher than their 2% target, they have reduced the chances of rate cuts to only once this year instead of the original 3-4 times. The 10-year Treasury yield controls mortgage rates, but if the FED were to cut short-term rates, it would significantly assist home buyers in purchasing homes. In the meantime, the seasonal downtrend in interest rates is gaining momentum.
Where are the opportunities to capitalize on lower rates?
Home buyers are facing mortgage rates near a two-decade high. Low housing inventory and high financing rates have led to a decline in the mortgage sector.
In a recent article for Barchart, "Long-Term Yields Poised to Fall – Lower Mortgage Rates Near," I wrote: "The recent interest rate for a 30-year loan, reported by Freddie Mac, was 7.02%, down from 7.09% the previous week. Nobody knows precisely where yields will go, but consider how much you can save by lowering your finance cost on a 30-year loan.
We will use the current median US home price of $412,000 as the loan amount. If the consumer gets a fixed 7% loan, their monthly principal and interest (P&I) would be $2,741. However, if they were to wait for rates to drop and could get a 6% loan, that same monthly P&I would be $2,470, a savings of $271 per month."
As the yield on 10-year Treasuries has declined, home loan applications, according to the Mortgage Bankers Association (MBA), have increased 16% from the previous week.
Couple these lower financing rates with reports of rising inventory levels, and home buyer sentiment could shift to a more bullish tone as we enter Summer.

Source: Federal Reserve Economic Data (FRED)
Since the beginning of May, mortgage rates have declined. Nobody knows how much lower they will go, but the seasonal pattern for lower rates contributes to this decline. Understanding seasonal patterns in markets can help consumers and speculators alike. As a home buyer or somebody looking to refinance a higher rate, knowing that this pattern of lower yields occurs most years between May and August, locking in mortgage loans closer to the end of August could save consumers thousands of dollars.
For speculators, the CMEGroup Exchange offers futures contracts on the (TO) 10Y yield contract, the (VU) micro-ultra 10-year note, the ZN 10-year Treasury note, the ZF 5-Year Treasury Note, and the ZB 30-year Treasury bond. Equity traders can use the ETFs IEF or TLT. Options traders can find opportunities for both futures and equity products.
Update on seasonal pattern
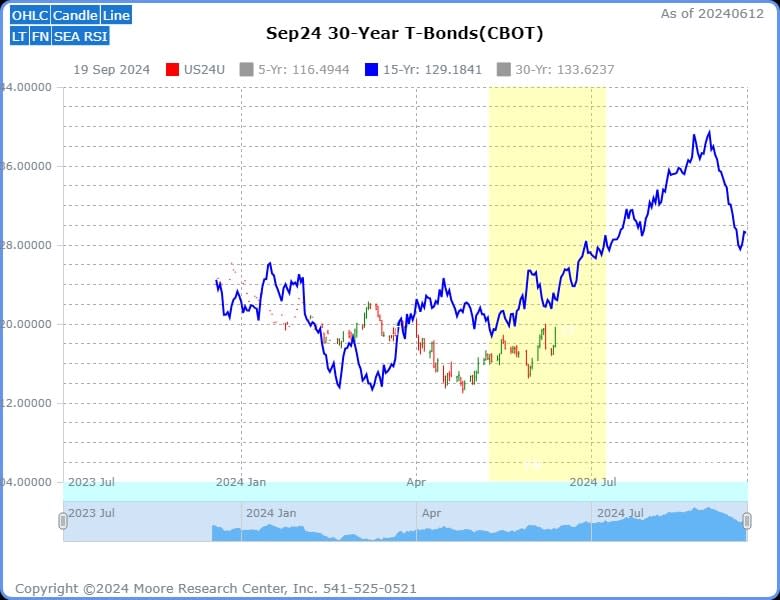
The recent 30-year seasonal pattern for lower interest rates began around May 09.
Source: Barchart.com
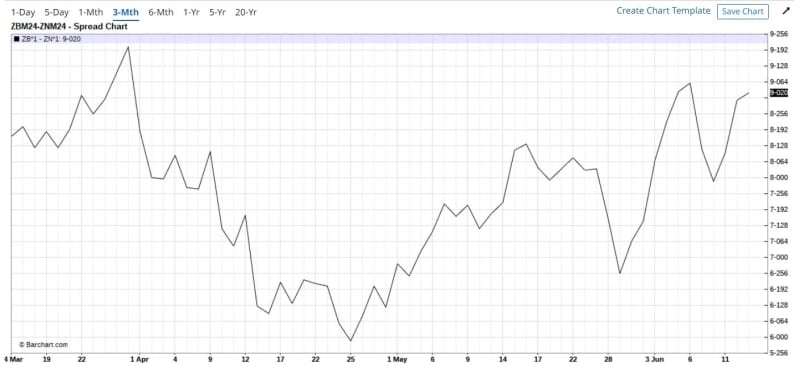
The Notes over Bonds spread has been trending strongly to the upside. When this spread is in an uptrend, traders buy the 30-year Treasury Bond more aggressively than the 10-year Treasury Note, indicating investors are locking in today's relatively high rates as they see rates going lower.
Source: Moore Research Center, Inc. (MRCI)
The yellow box represents the recent seasonal buy pattern optimal window, which began around the beginning of May. The blue line represents the 15-year pattern of 30-year Treasury Bond prices. MRCI research finds these optimal windows for particular markets that moved significantly up or down but had a minimal drawdown during that period.
Confluence of seasonal patterns
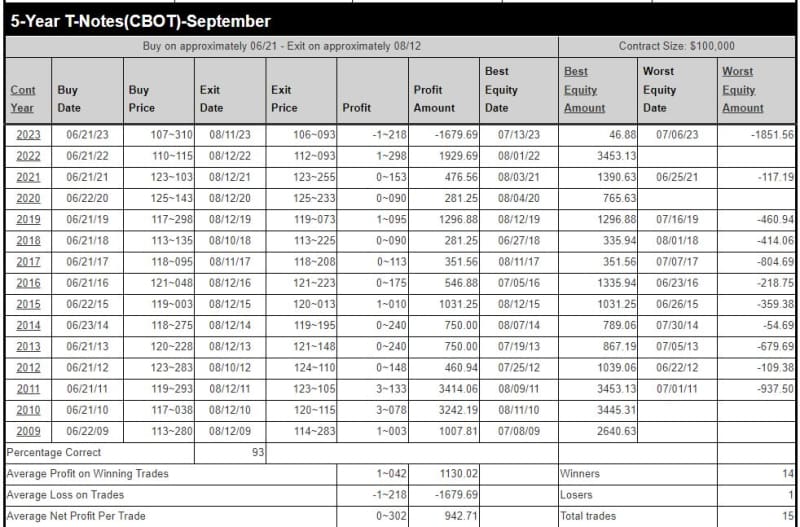
Due to the length of this seasonal pattern of declining rates, other maturities will have seasonal patterns that coincide with the 30-year Treasury Bond. For example, MRCI research found that the 5-year Treasury Note (ZF) closed higher on approximately August 12 than on June 21 for 14 of the past 15 years, touting a win rate of 93%. The results of this pattern have led to lower yields in August, just as the 30-year Treasury Bond is expected to do.
It's important to note that while seasonal patterns can provide valuable insights, they should not be the sole basis for trading decisions. Traders must consider other technical and fundamental indicators, risk management strategies, and market conditions to make well-informed and balanced trading choices.
Source: MRCI
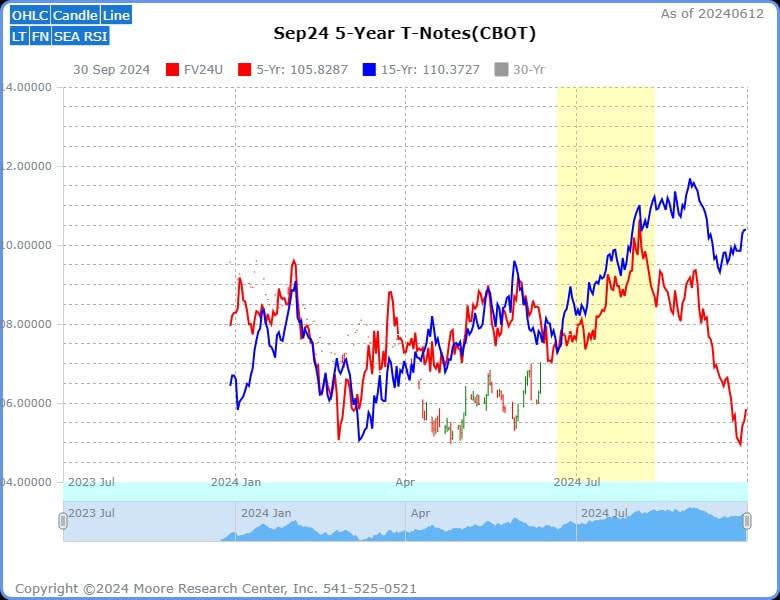
The yellow box indicates the optimal window that MRCI research has found for optimal price increase with limited drawdown. An interesting pattern is beginning to emerge for the 5-Year Treasury Note. The red line is the five-year average, and the blue line is the 15-year average of historical prices. Notice the divergence between the two lines at the end of the optimal window. The five-year average shows that this seasonal pattern of lower rates may be getting shorter. Could this be the result of the pandemic economic crisis?
Source: MRCI
The above table from MRCI research reveals how they find seasonal patterns with high win rates and minimal drawdowns. The 5-year Treasury pattern had four years out of 15 without a daily closing drawdown.
In closing
The Federal Reserve's decision to keep the Fed Funds rate unchanged at 5.25% to 5.50% reflects the ongoing challenge of high inflation, reducing the likelihood of multiple rate cuts this year. This has significant implications for the mortgage market, where home buyers have been facing rates near a two-decade high, resulting in declining mortgage applications. However, the seasonal downtrend in interest rates is gaining momentum, presenting opportunities for home buyers and speculators.
As mortgage rates show signs of declining, recent data indicates an increase in home loan applications. Understanding seasonal patterns can be advantageous, with rates typically lower between May and August. Locking in rates towards the end of August could lead to significant savings for those looking to capitalize.
While the Fed is cautious, the seasonal trends and market dynamics allow home buyers and speculators to benefit from potentially lower rates soon.
More Stock Market News from Barchart
On the date of publication, Don Dawson did not have (either directly or indirectly) positions in any of the securities mentioned in this article. All information and data in this article is solely for informational purposes. For more information please view the Barchart Disclosure Policy here.